Confounding Variables
Identify and control for confounding variables
What You'll Learn
- What confounding variables are
- How they distort relationships
- Identifying confounders
- Controlling for confounders
- Real-world examples
Confounding Variables
Definition: A variable that influences both the independent and dependent variables, creating a false association
The problem: Makes it look like X causes Y, when really Z causes both!
Example: Correlation: Ice cream sales & drowning deaths Confounder: Hot weather (causes both!)
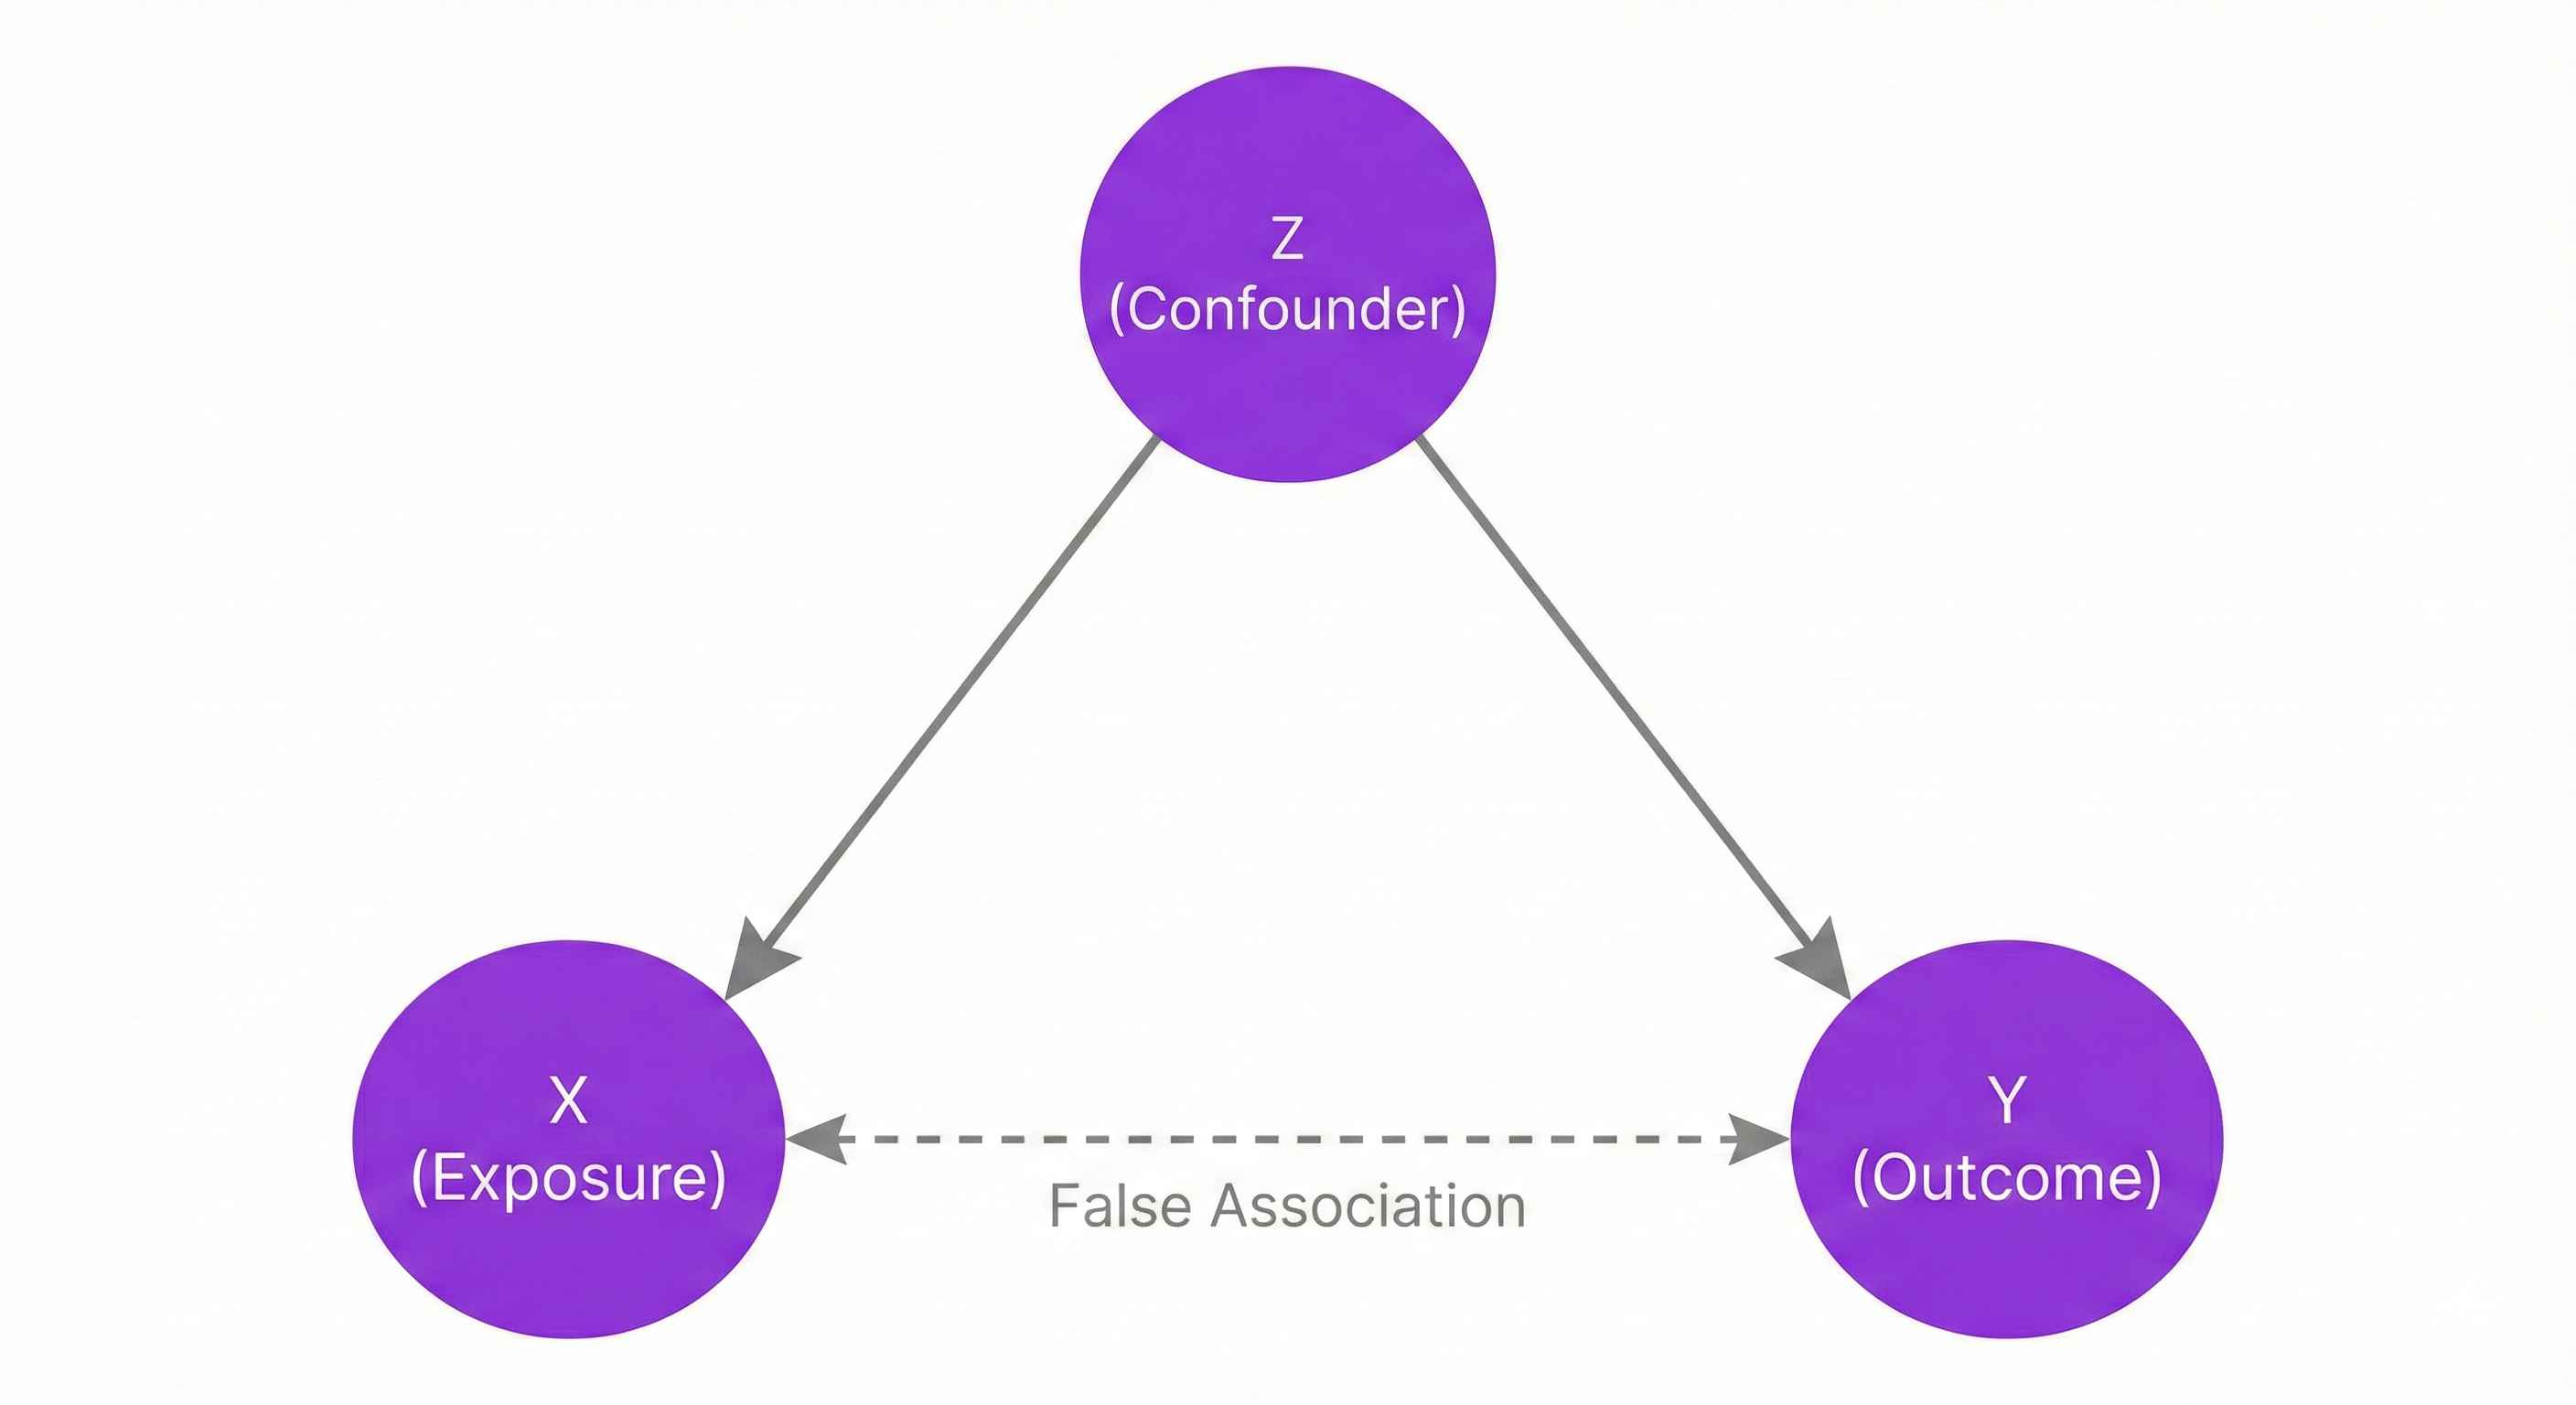
How Confounding Works
Direct relationship: X → Y (what we observe)
Hidden reality: Z → X Z → Y (Z is the confounder)
Result: We think X causes Y, but both are caused by Z!
Classic Examples
Coffee & Heart Disease: Observed: Coffee drinkers have higher heart disease Confounder: Smoking (coffee drinkers more likely to smoke) Reality: Smoking causes heart disease, not coffee
Education & Income: Observed: More education = higher income Confounders: Family wealth, IQ, social connections Reality: Multiple factors at play
Exercise & Health: Observed: Exercise correlates with better health Confounders: Diet, age, income, healthcare access Reality: Healthier people can exercise more
Identifying Confounders
Ask these questions:
- What else could cause both variables?
- What have we not measured?
- Is there a common cause?
Criteria for confounder:
- Associated with exposure (X)
- Associated with outcome (Y)
- NOT in causal pathway (not X → Z → Y)
DAGs (Directed Acyclic Graphs)
Visual tool for showing relationships:
Simple correlation: X → Y
With confounder: Z ↙ ↘ X Y
Chain (not confounding): X → Z → Y
Controlling for Confounders
Method 1: Randomization Randomly assign groups
- Used in experiments
- Distributes confounders evenly
- Gold standard!
Method 2: Stratification Analyze within groups
- Look at smokers separately from non-smokers
- Control for age groups
- Simple but requires large samples
Method 3: Matching Match subjects on confounders
- Pair smokers with smokers
- Same age, gender, etc.
- Good for case-control studies
Method 4: Statistical Control Use regression models
- Multiple regression
- Control for multiple variables
- Most common in practice
Real-World Case Study
Question: Does vitamin supplement use improve health?
Observed: Supplement users are healthier
Confounders:
- Income (can afford supplements & healthcare)
- Health consciousness (exercise, diet)
- Education (know about health)
- Age (younger people use supplements)
Conclusion: Can't say supplements work without controlling for confounders!
Simpson's Paradox Preview
Extreme confounding: Relationship reverses when accounting for confounder!
Example: Overall: Treatment A looks worse By age group: Treatment A is better in every group!
(More in next lesson)
Practice Exercise
Scenario: Cities with more hospitals have higher death rates
Questions:
- Does this mean hospitals cause death?
- What's the confounder?
- How would you control for it?
Answers:
- No! Classic confounding
- Population size / disease prevalence
- Control for city size and baseline health
Prevention Strategies
In research:
- Randomized controlled trials
- Careful measurement
- Include potential confounders
- Statistical adjustment
In analysis:
- Think about what's missing
- Don't assume causation
- Control for known confounders
- Report limitations
Common Mistakes
Mistake 1: Controlling for mediators (things in causal path)
Mistake 2: Not thinking of confounders before analysis
Mistake 3: Assuming no unmeasured confounders
Mistake 4: Over-controlling (controlling for everything)
Next Steps
Learn about Simpson's Paradox!
Tip: Always ask "What else could explain this relationship?"