Central Limit Theorem
The magic behind why statistics works
The Most Important Idea in Statistics
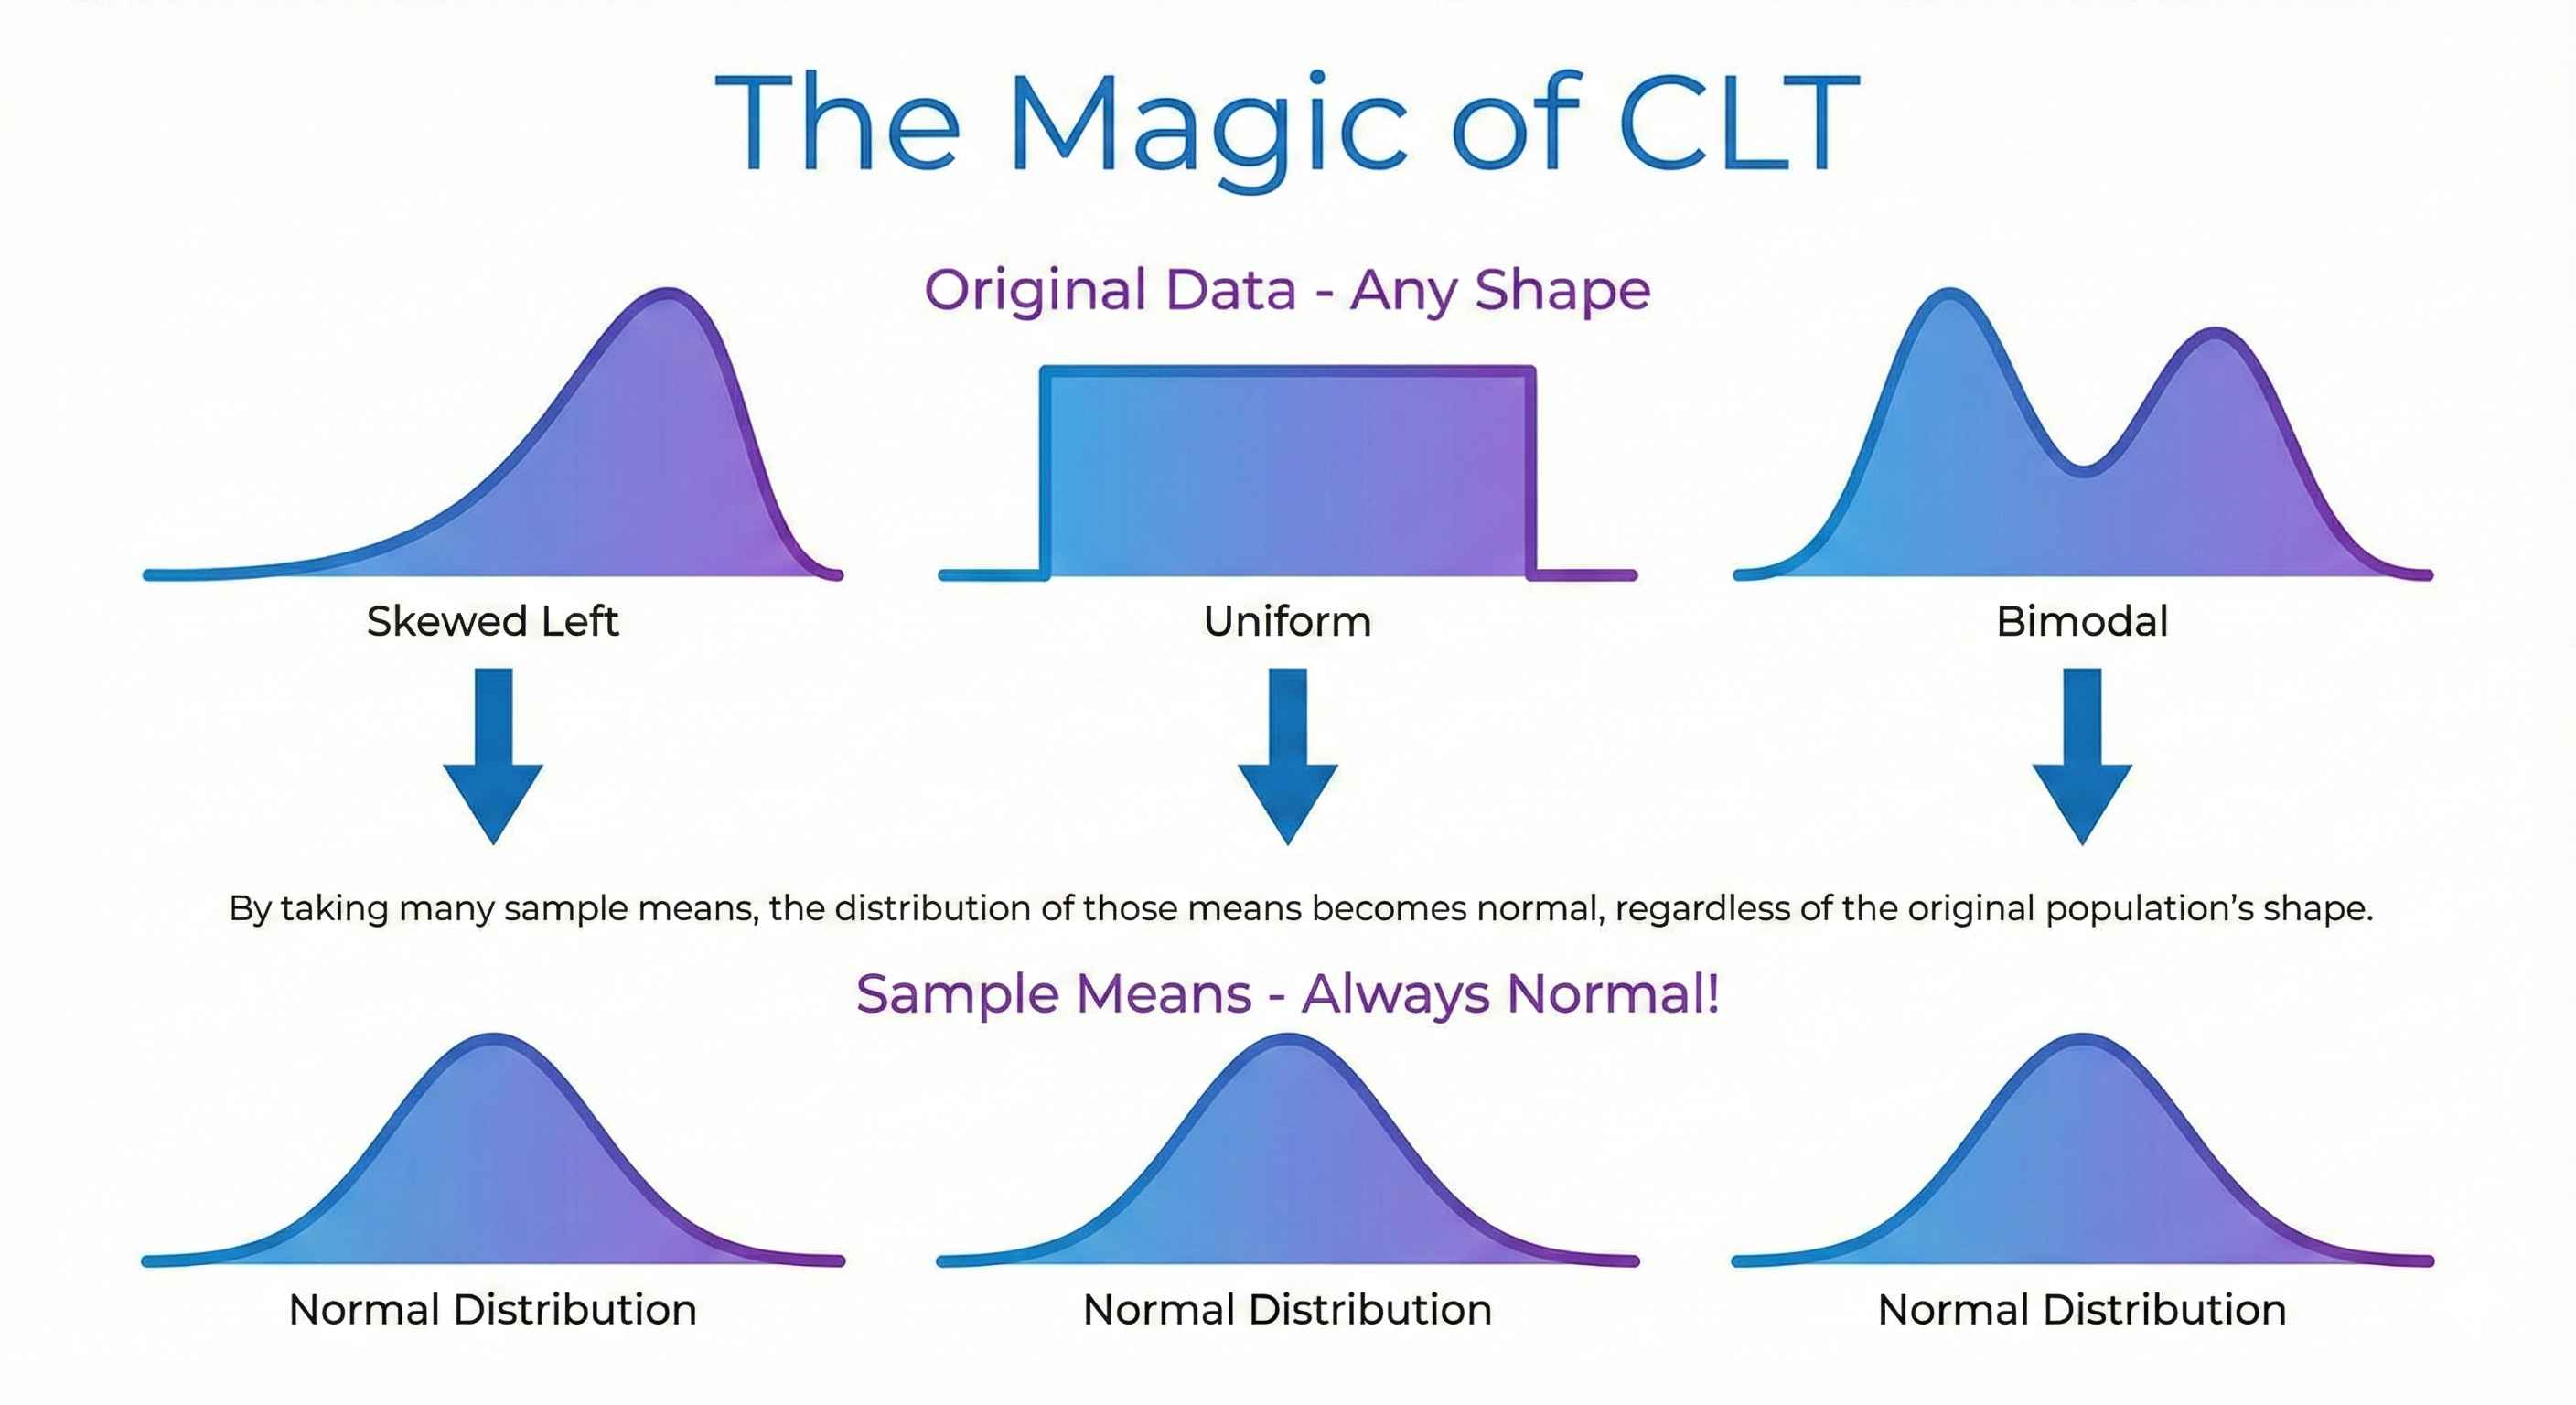
Central Limit Theorem (CLT): Take enough samples, and their averages will form a normal distribution — no matter what the original data looks like!
This is why we can make predictions from samples. It's like magic, but it's math.
The Simple Explanation
Imagine you:
- Take many random samples from ANY data (even weird-shaped data)
- Calculate the mean of each sample
- Plot all those means
Result: A beautiful bell curve (normal distribution)!
Why Does This Matter?
| Without CLT | With CLT |
|---|---|
| Can't generalize from samples | Can predict population from samples |
| Each dataset needs different rules | Same rules work for everything |
| Statistics wouldn't work | Polls, A/B tests, research all work! |
The Rules
For CLT to work:
- Sample size ≥ 30 (rule of thumb)
- Samples are random and independent
What you get:
- Mean of sample means = Population mean
- Spread gets tighter as sample size increases
Standard Error: How Precise?
Standard Error (SE) = How much sample means vary
SE = SD / √n
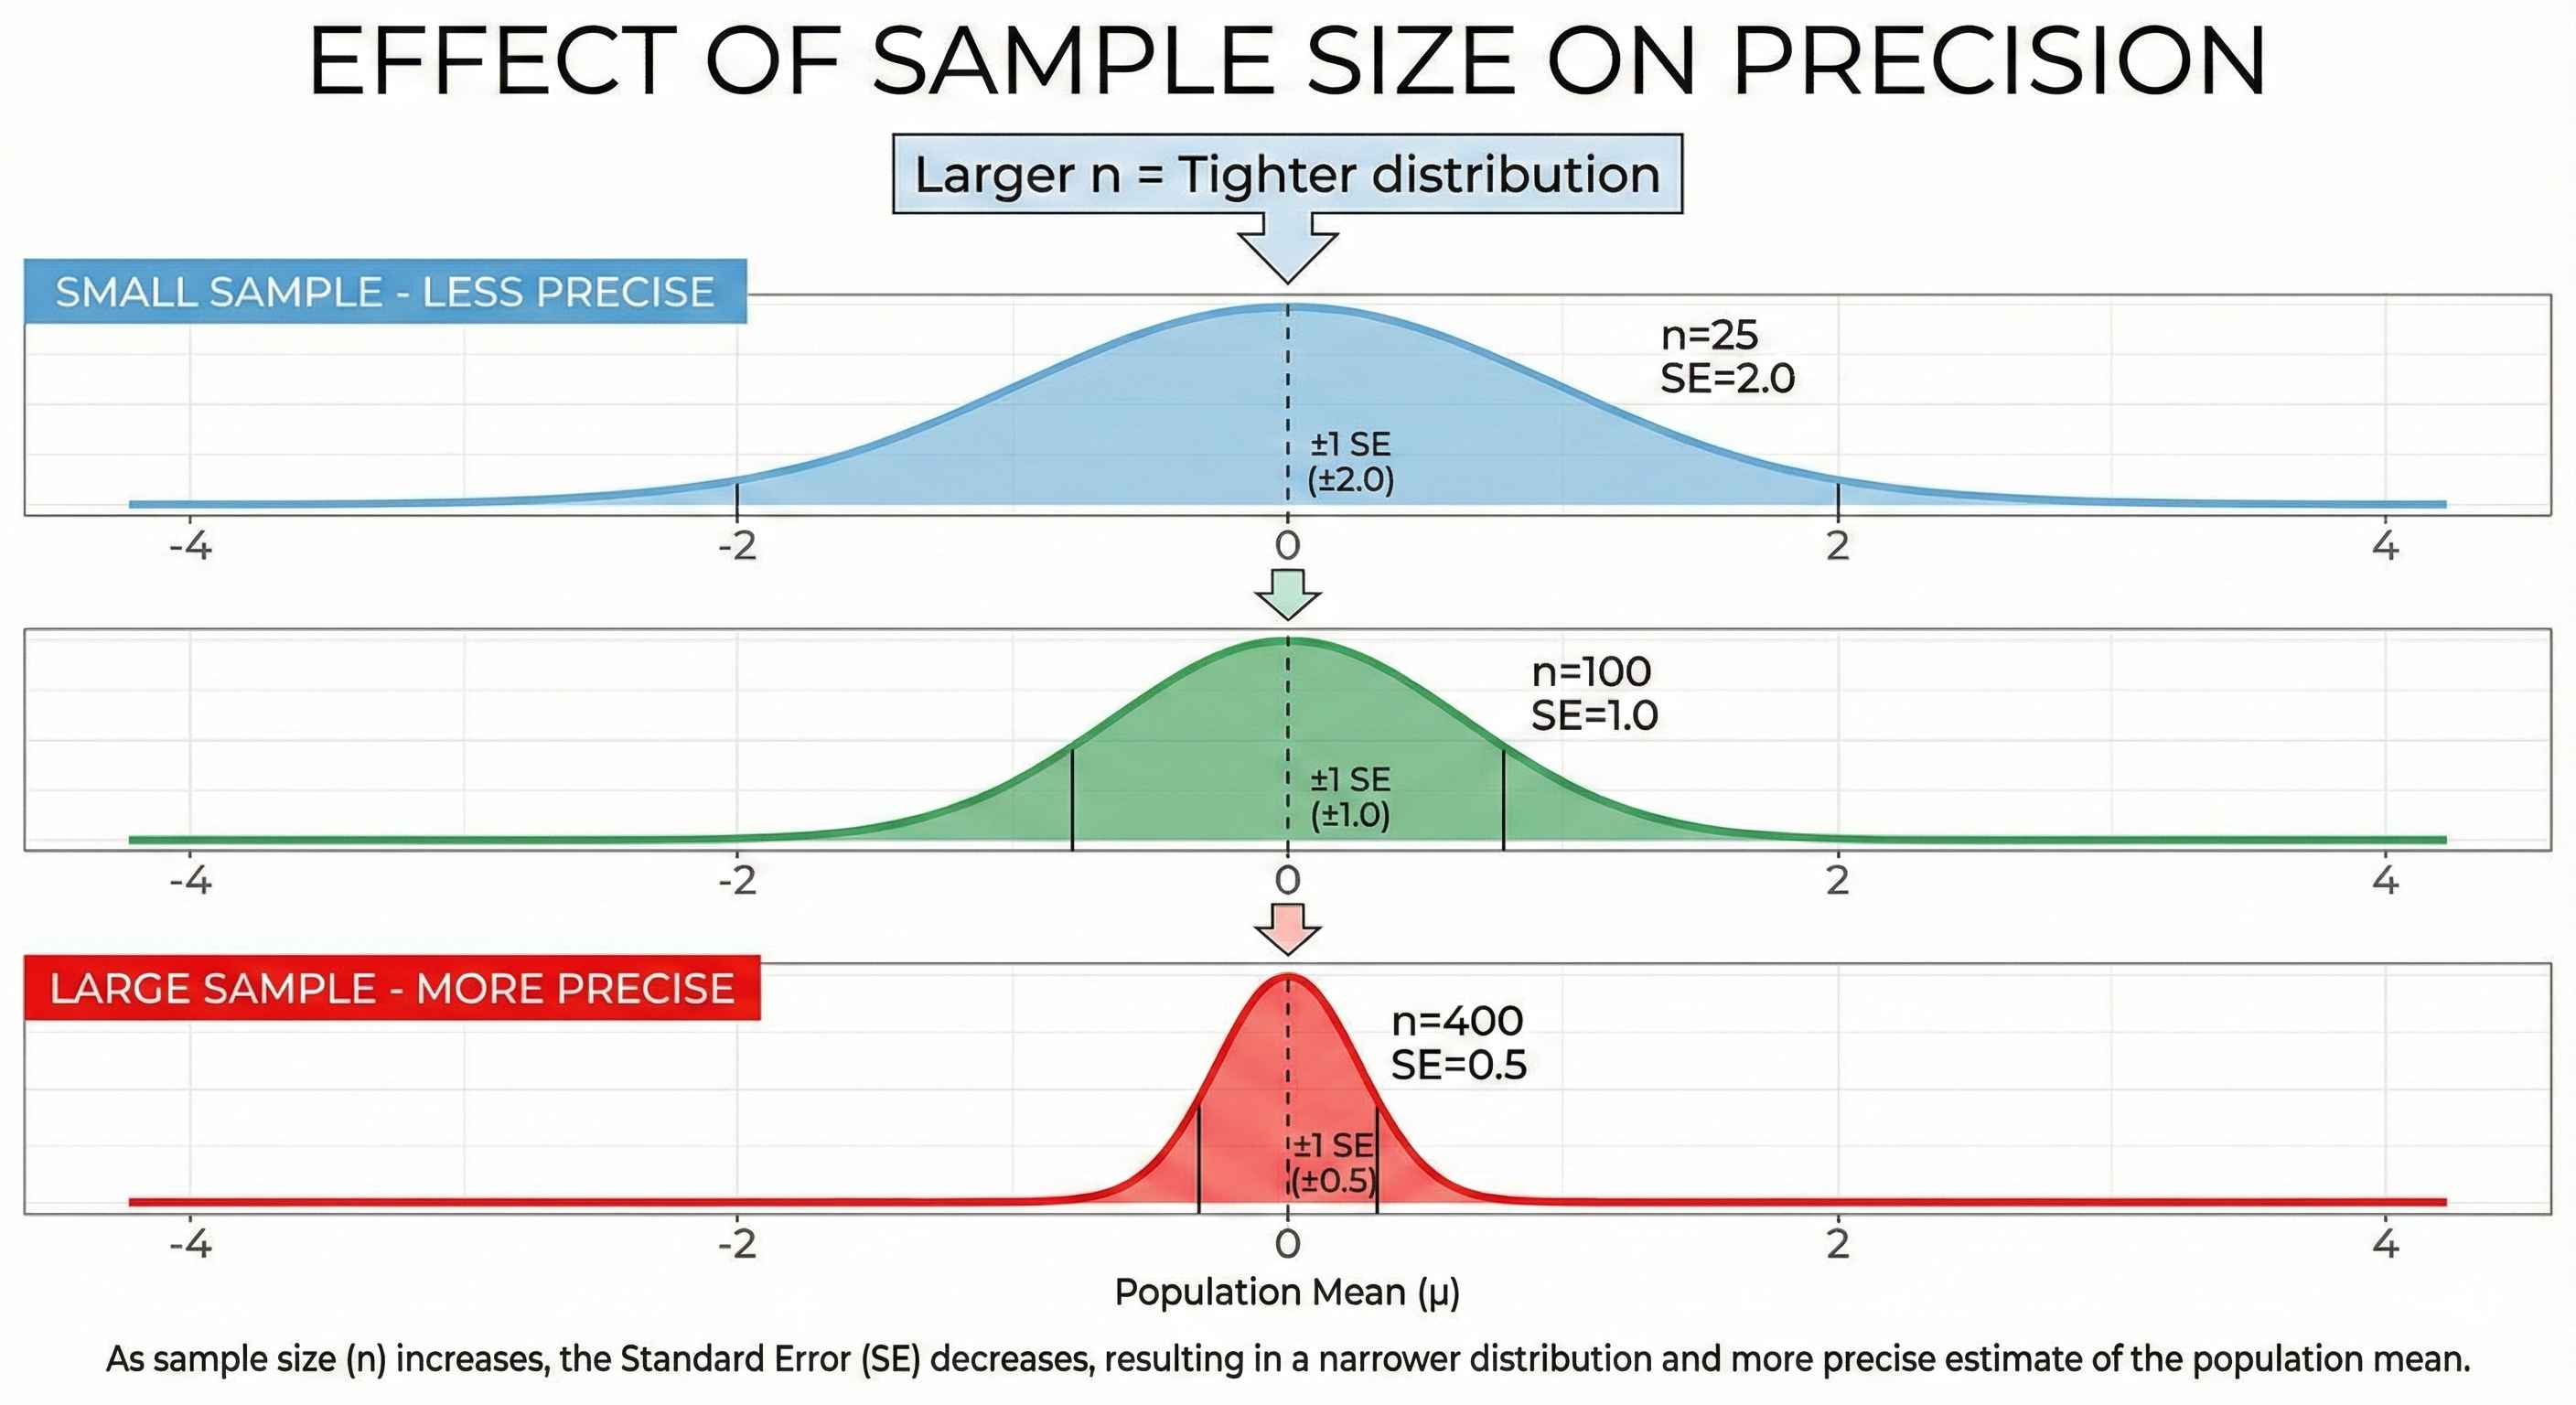
| Sample Size (n) | SE (if SD=10) | Precision |
|---|---|---|
| 25 | 10/√25 = 2.0 | Less precise |
| 100 | 10/√100 = 1.0 | More precise |
| 400 | 10/√400 = 0.5 | Very precise |
Key insight: 4x the sample size = 2x the precision
Real-World Examples
Election Polls: Survey 1,000 people → predict millions of voters
A/B Testing: Test on 10,000 users → predict behavior for all users
Quality Control: Check 100 products → estimate defect rate for entire batch
Medical Trials: Test drug on 500 patients → predict effectiveness for everyone
Quick Practice
Population: Mean = 50, SD = 10 Sample size: n = 100
- Standard Error = 10 / √100 = 1
- Sample means follow: Normal distribution with mean=50, SE=1
Tip: CLT is why a poll of 1,000 people can predict what millions think!