Module 1
5 min read
Your First Report
Build your first Power BI report step-by-step
Let's Build Your First Report
We'll create a simple sales dashboard with 3 visuals.
Step 1: Get Sample Data
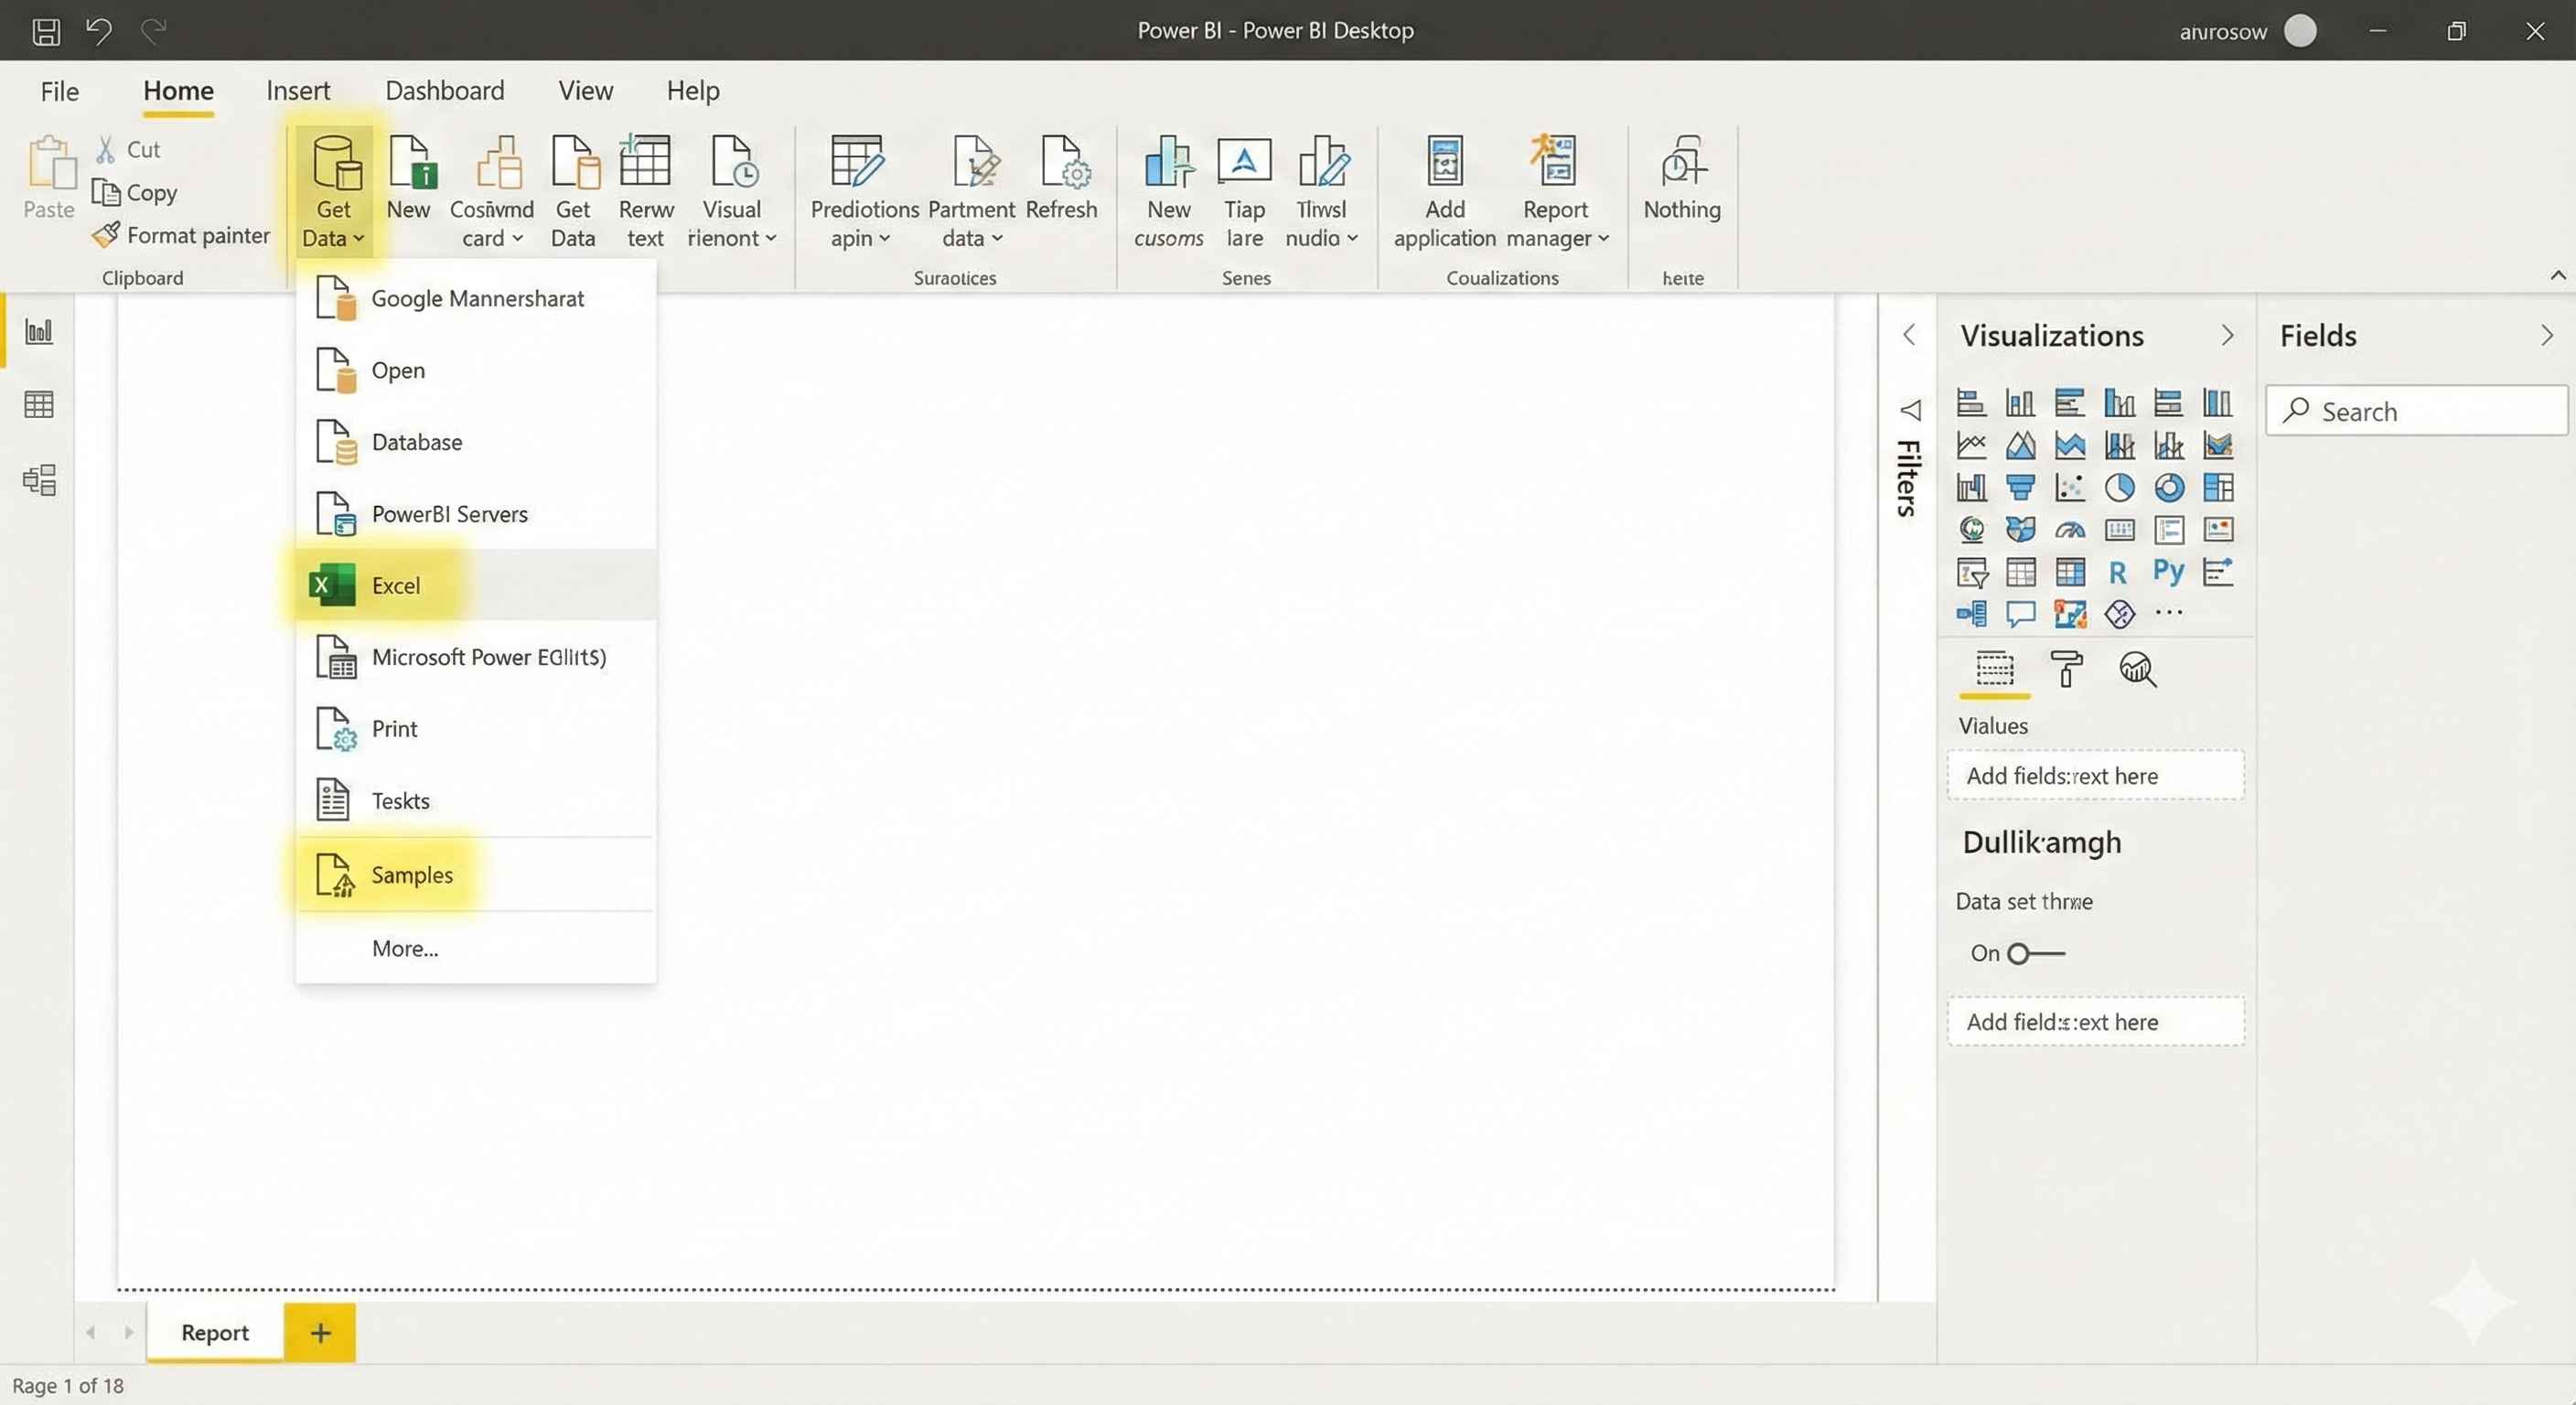
- Open Power BI Desktop
- Go to Home > Get Data > Samples > Financial Sample
- Click Load
Your data appears in the Fields pane on the right.
Step 2: Create a Bar Chart
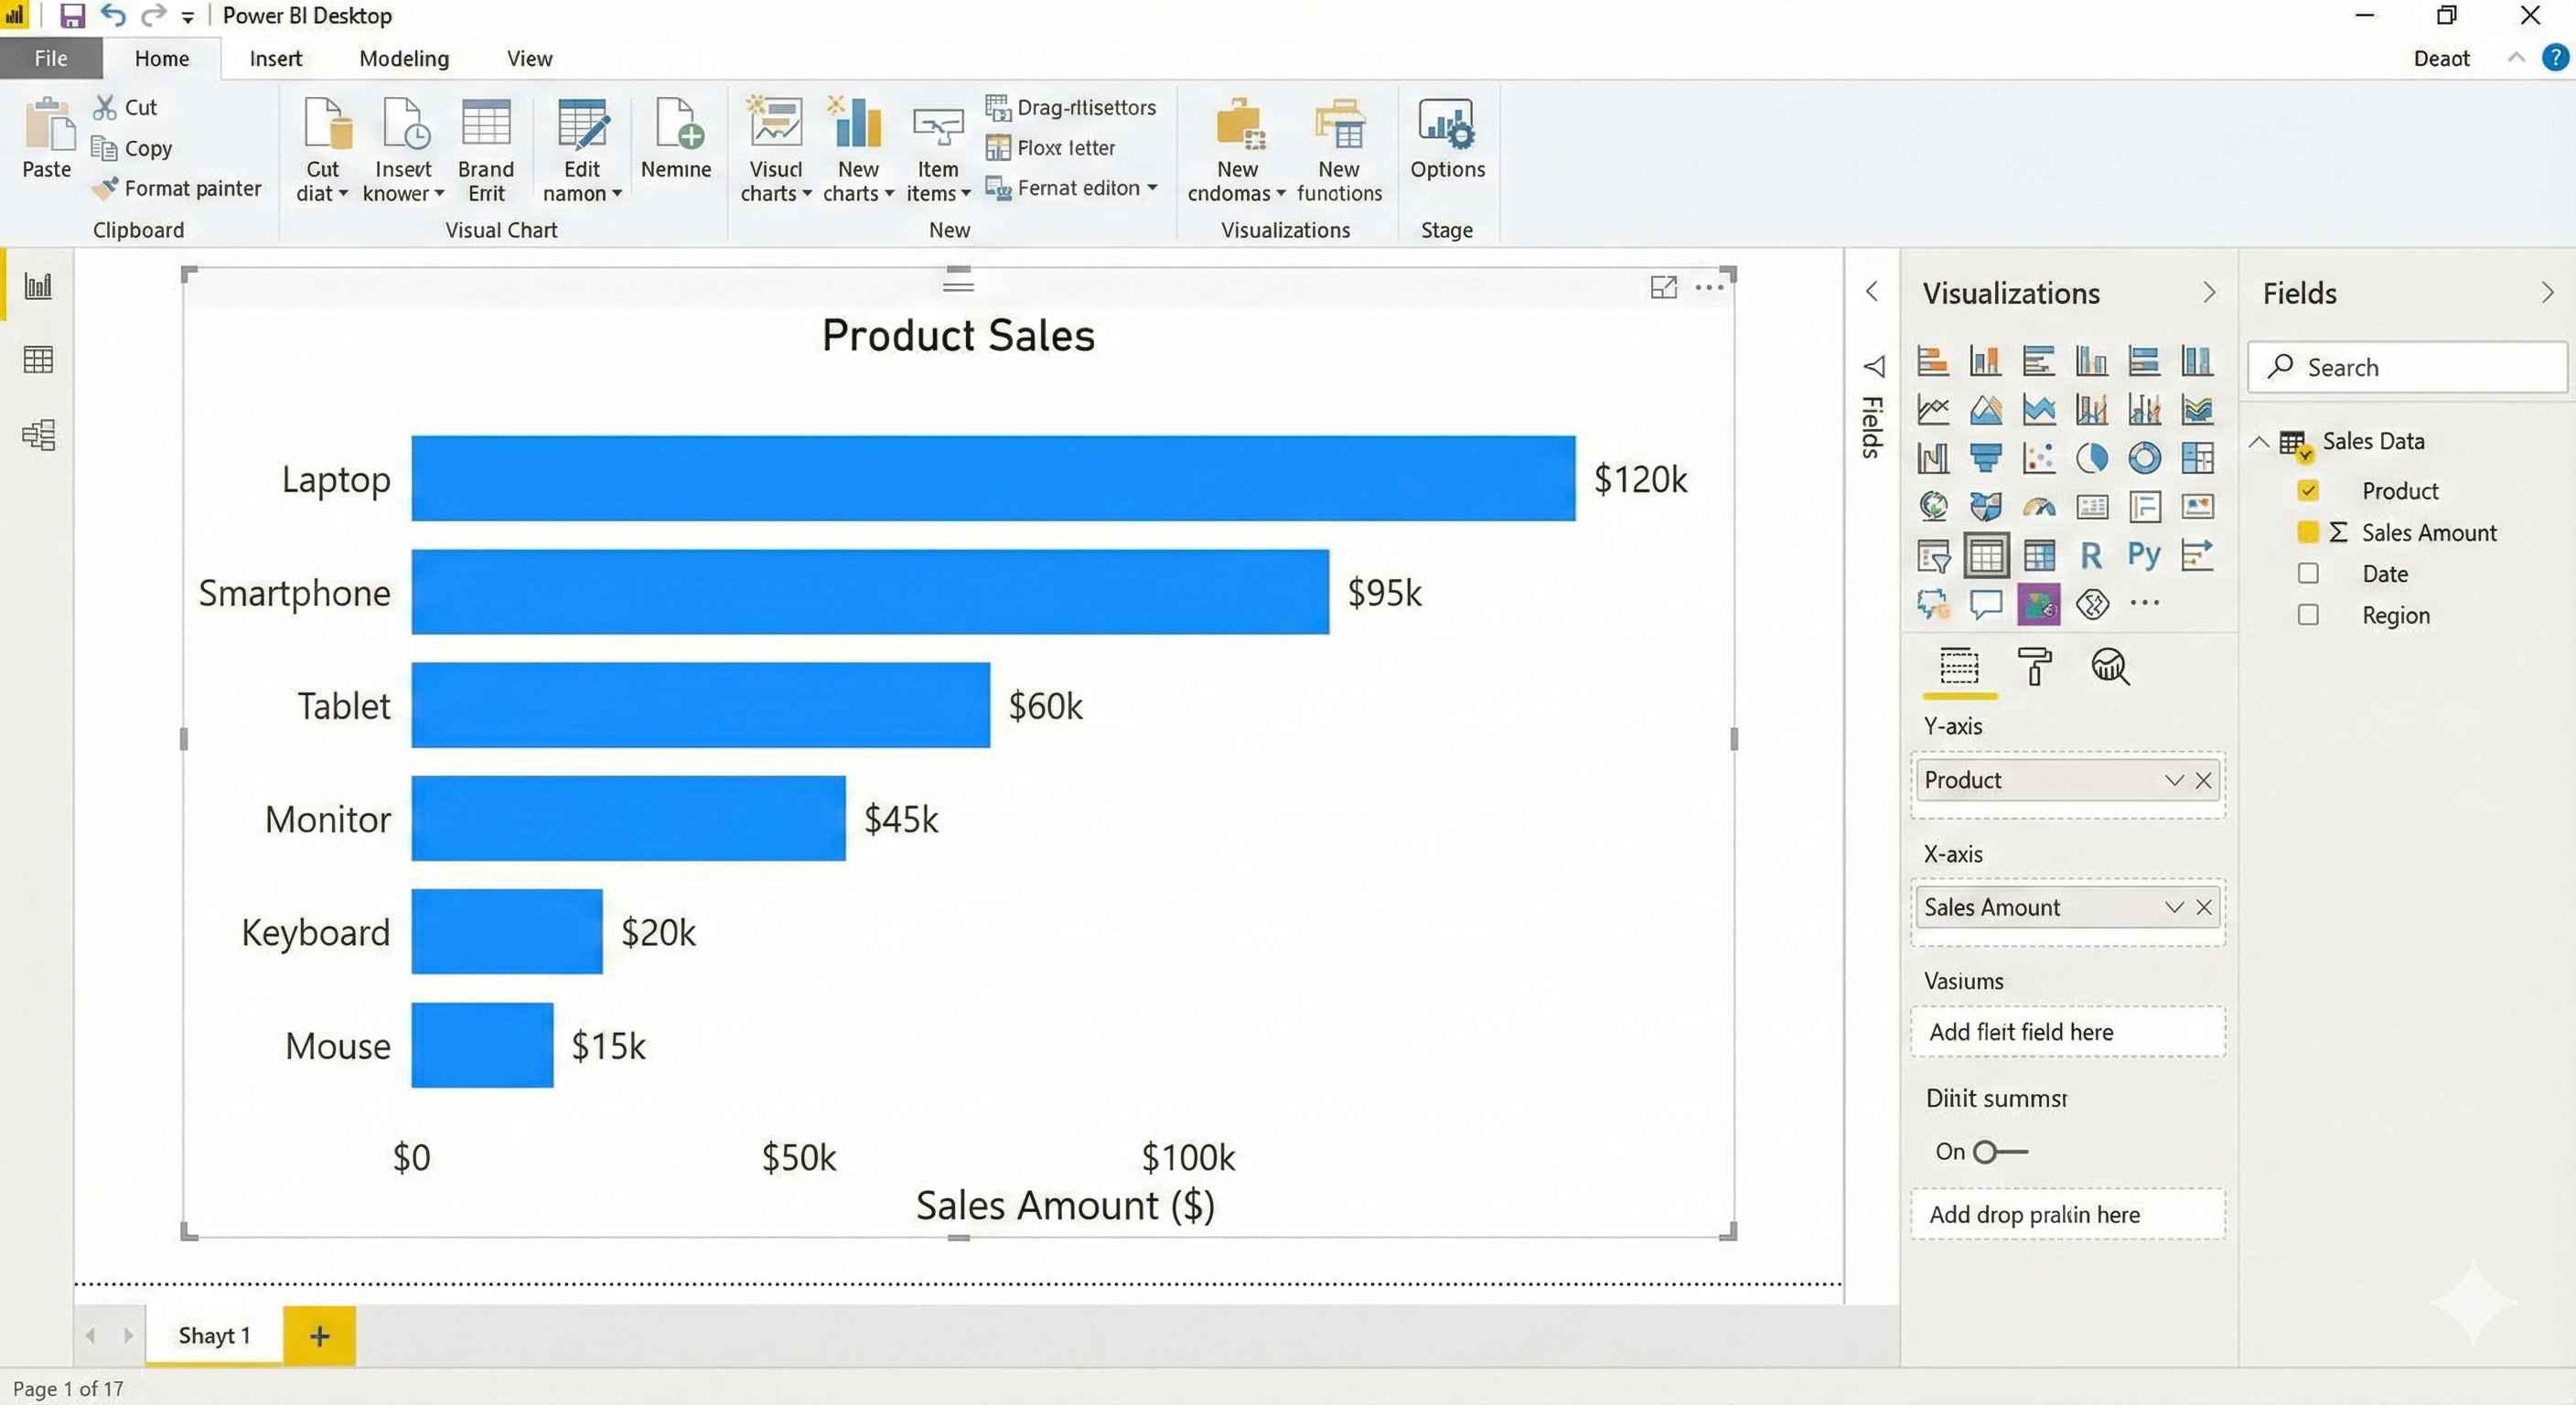
- Click Clustered Bar Chart in Visualizations pane
- Drag Product to Y-axis
- Drag Sales to X-axis
You just created your first chart!
Step 3: Add a Pie Chart
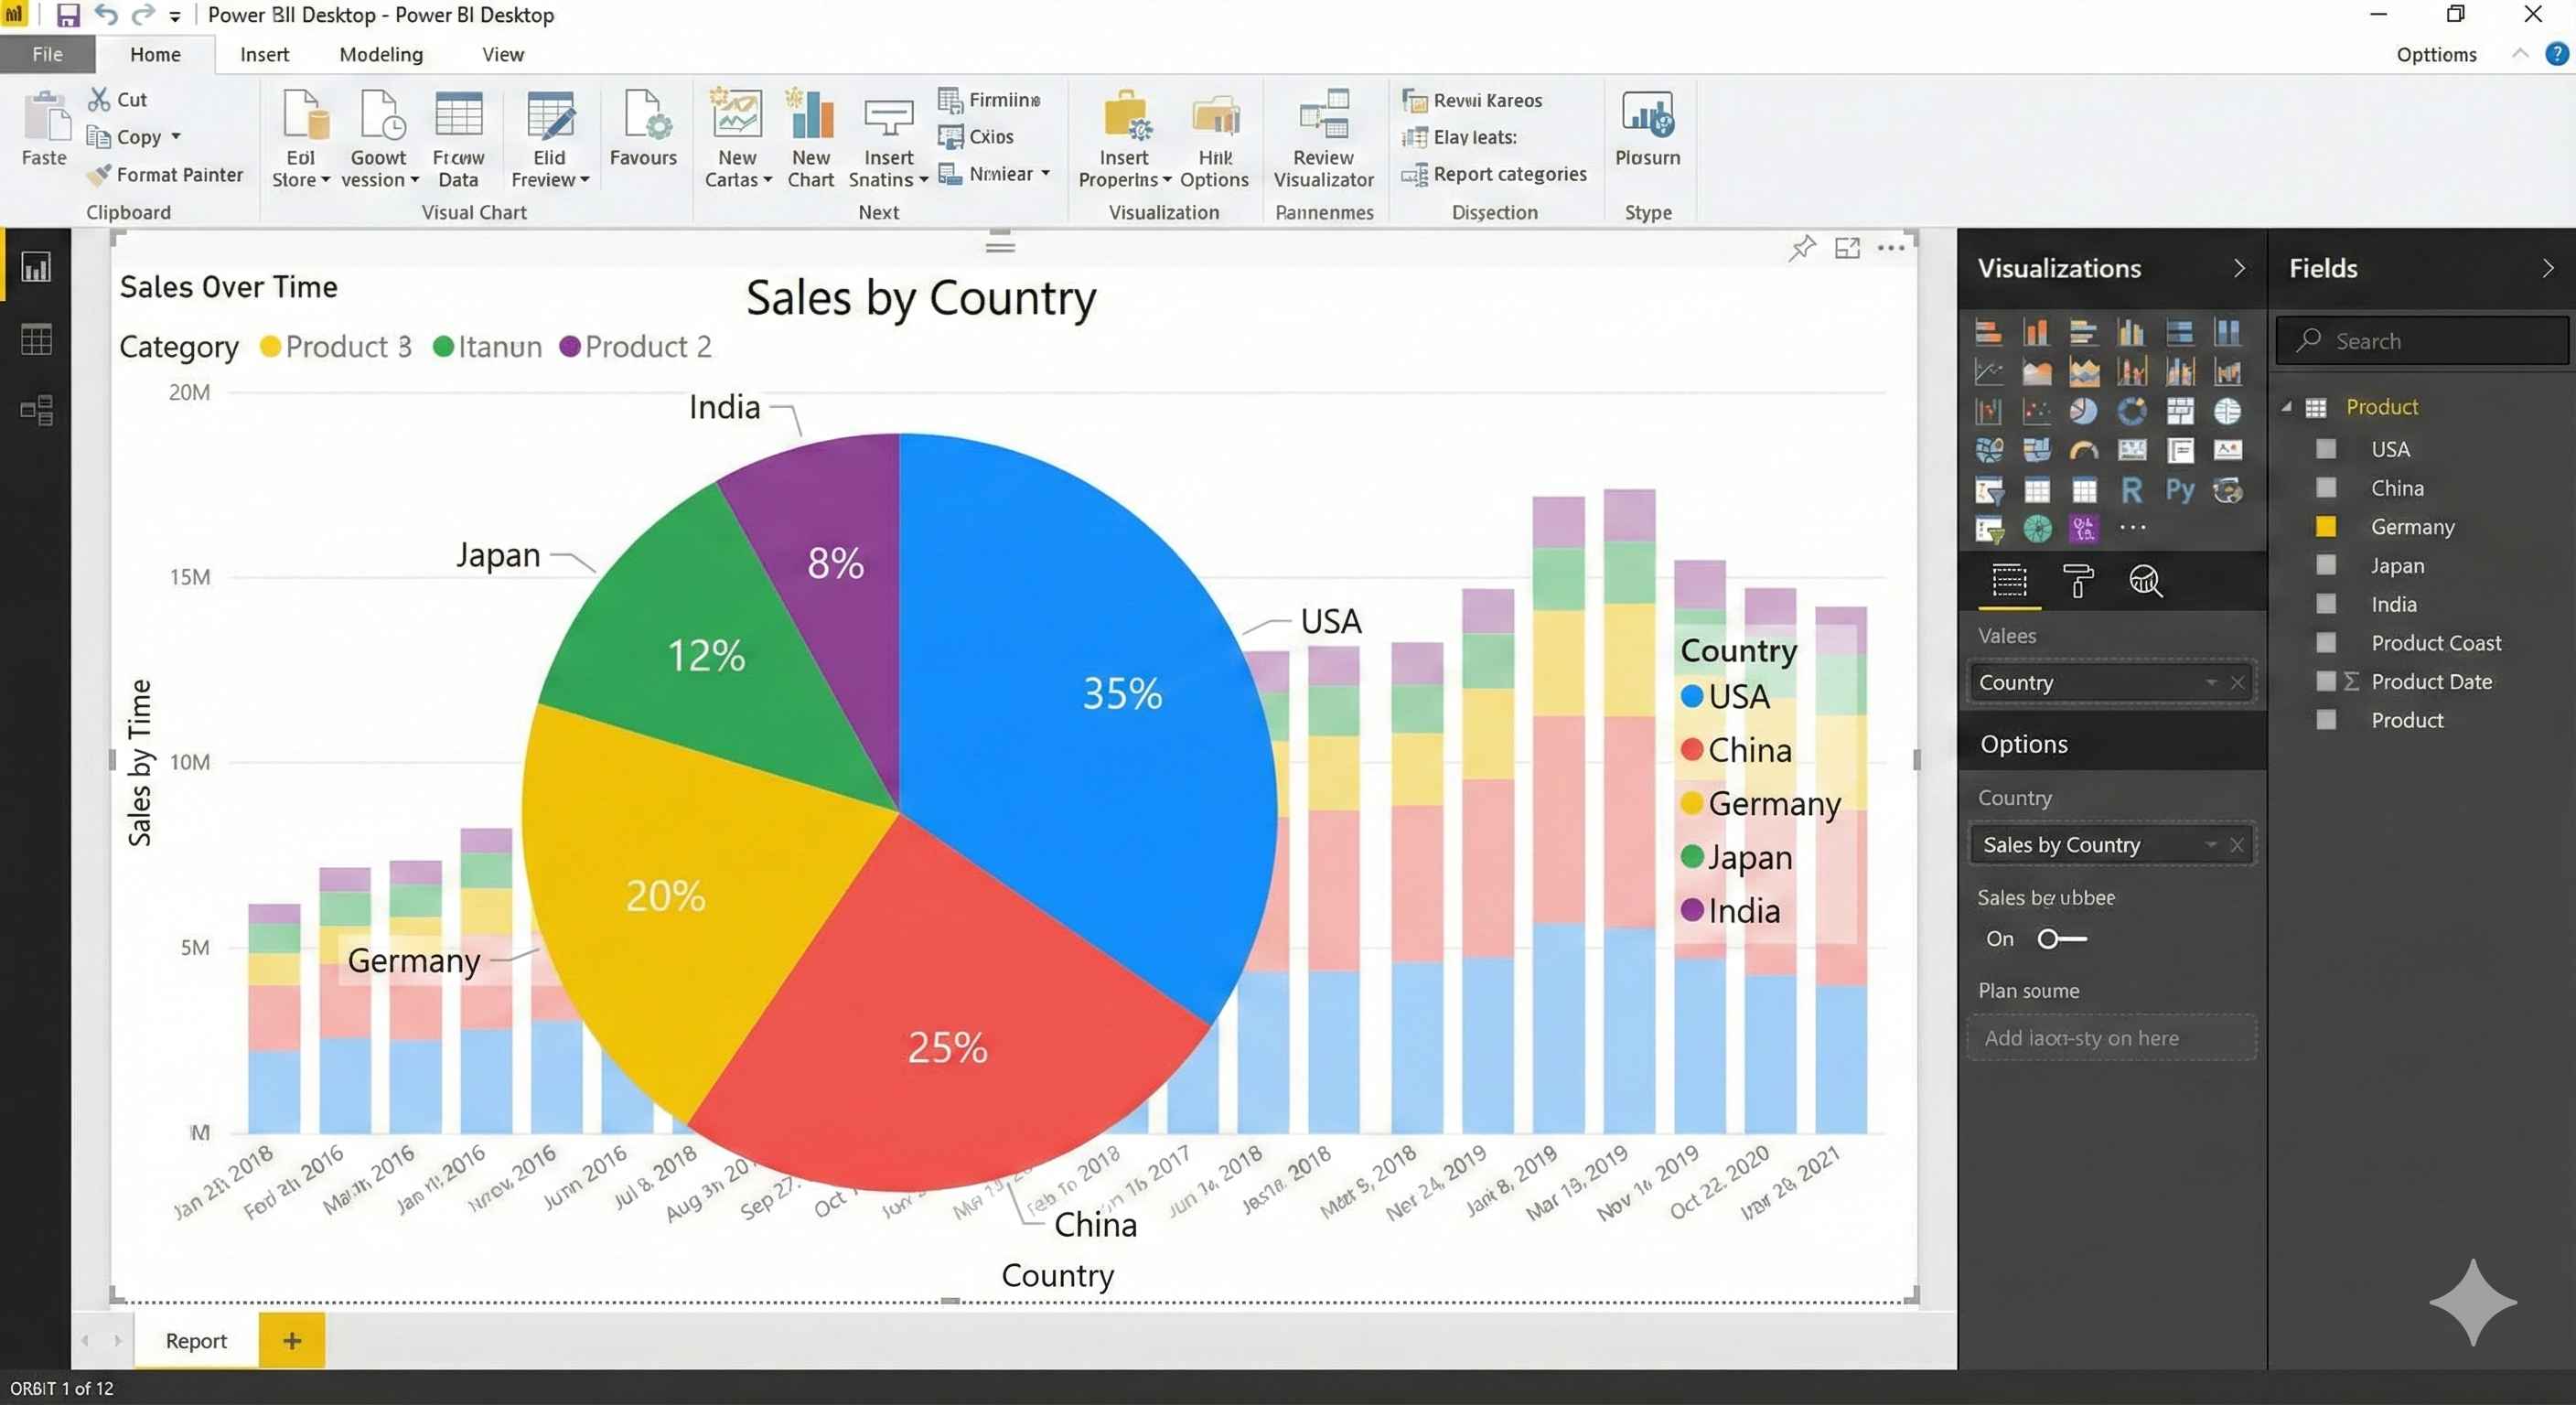
- Click empty space on canvas
- Click Pie Chart
- Drag Country to Legend
- Drag Sales to Values
Step 4: Add a Card (Total Sales)
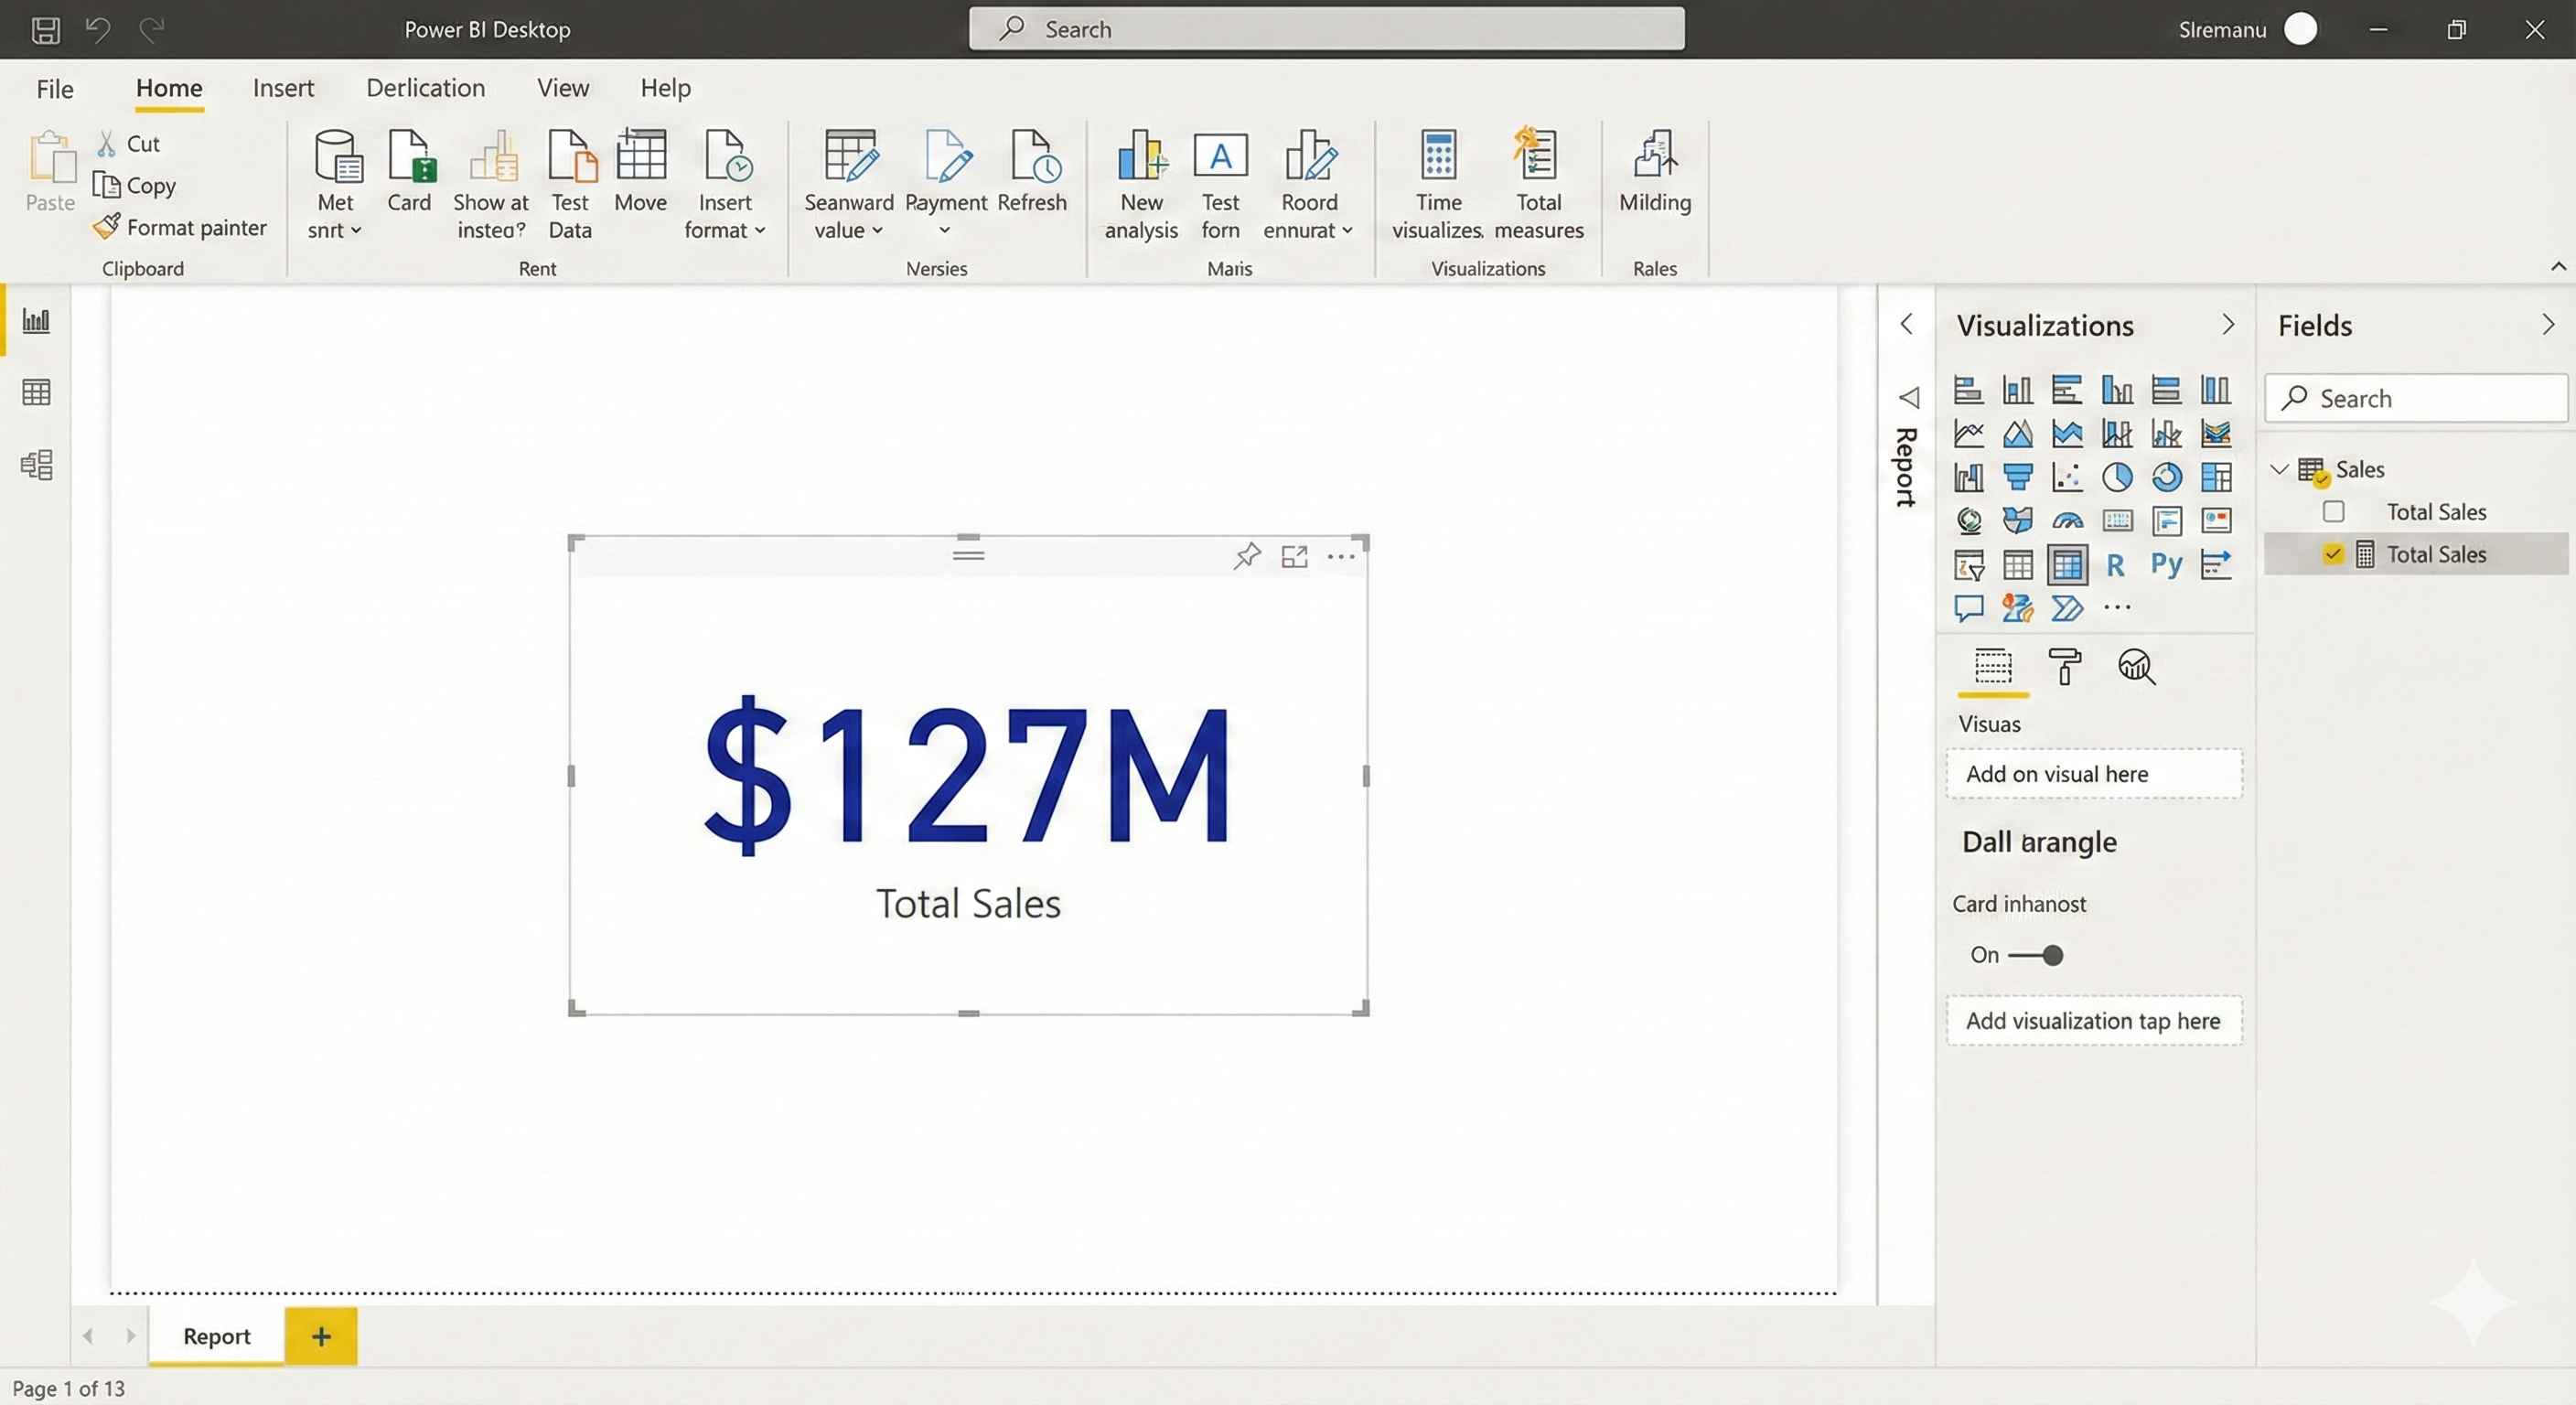
- Click empty space
- Click Card visual
- Drag Sales to Fields
This shows total sales as one big number.
Step 5: Add a Slicer (Filter)
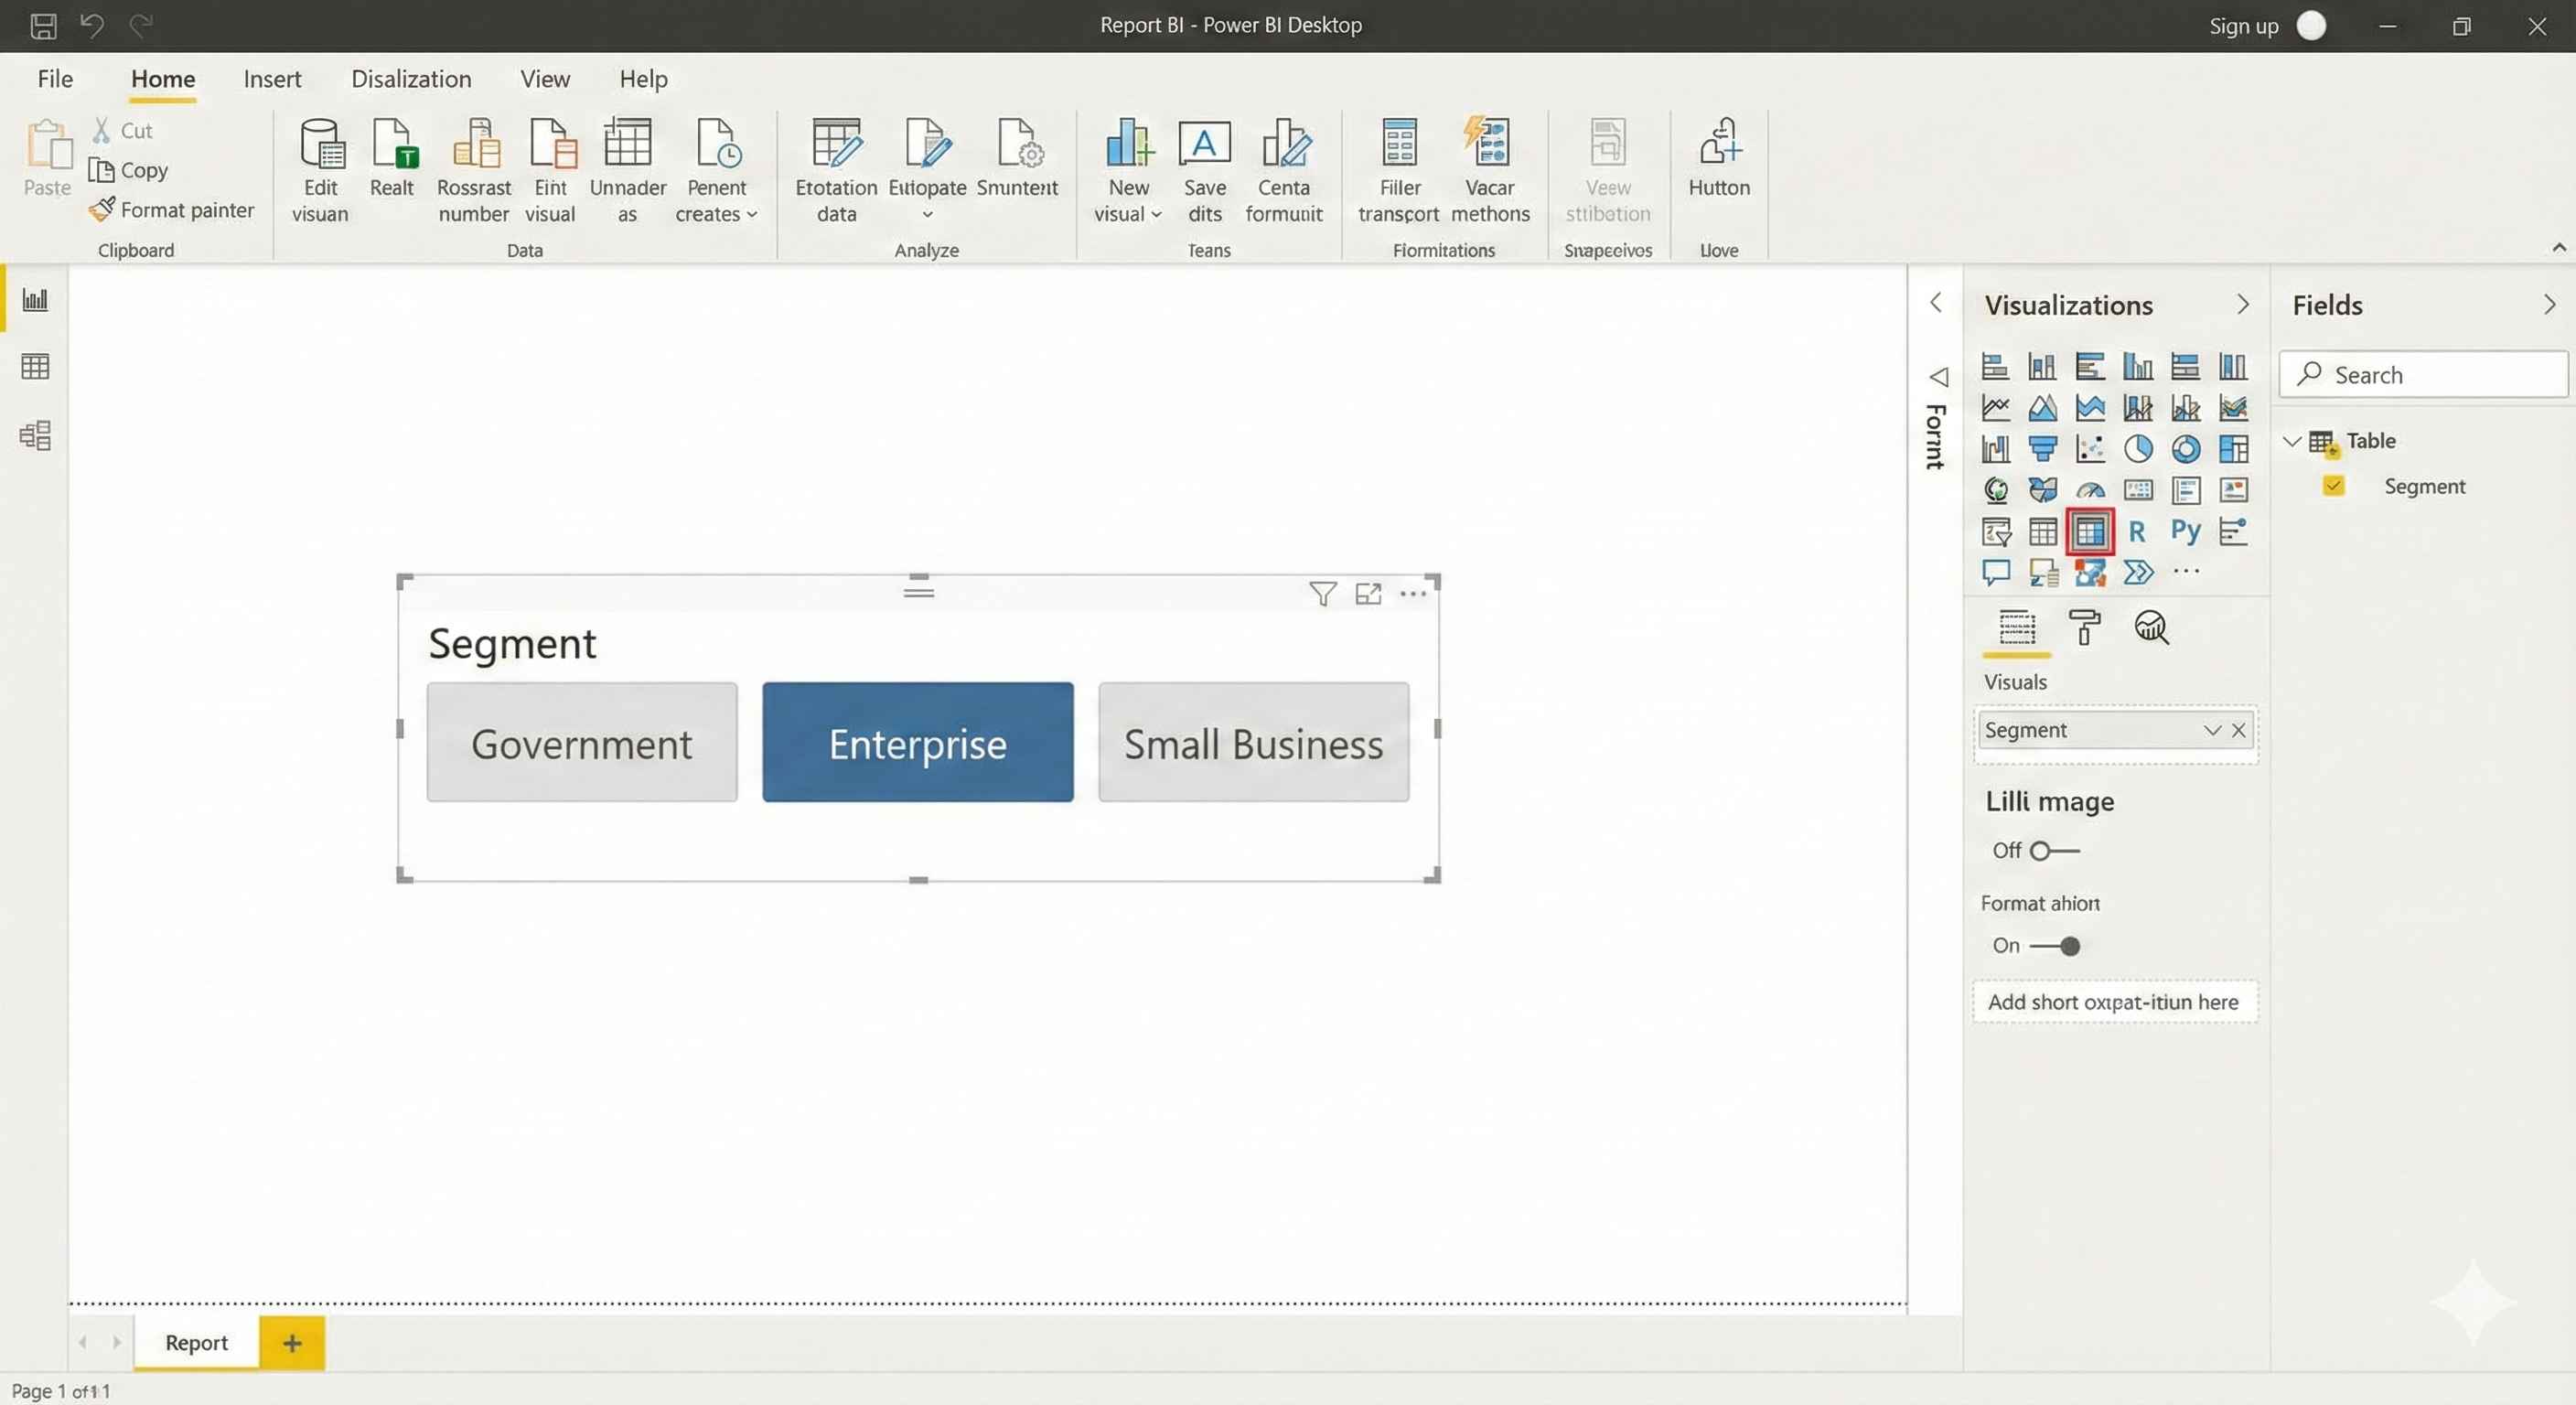
- Click Slicer visual
- Drag Segment to Field
- Click any segment to filter all visuals
Step 6: Arrange & Save
- Drag visuals to position them
- Resize by dragging corners
- File > Save As → name it "My First Report.pbix"
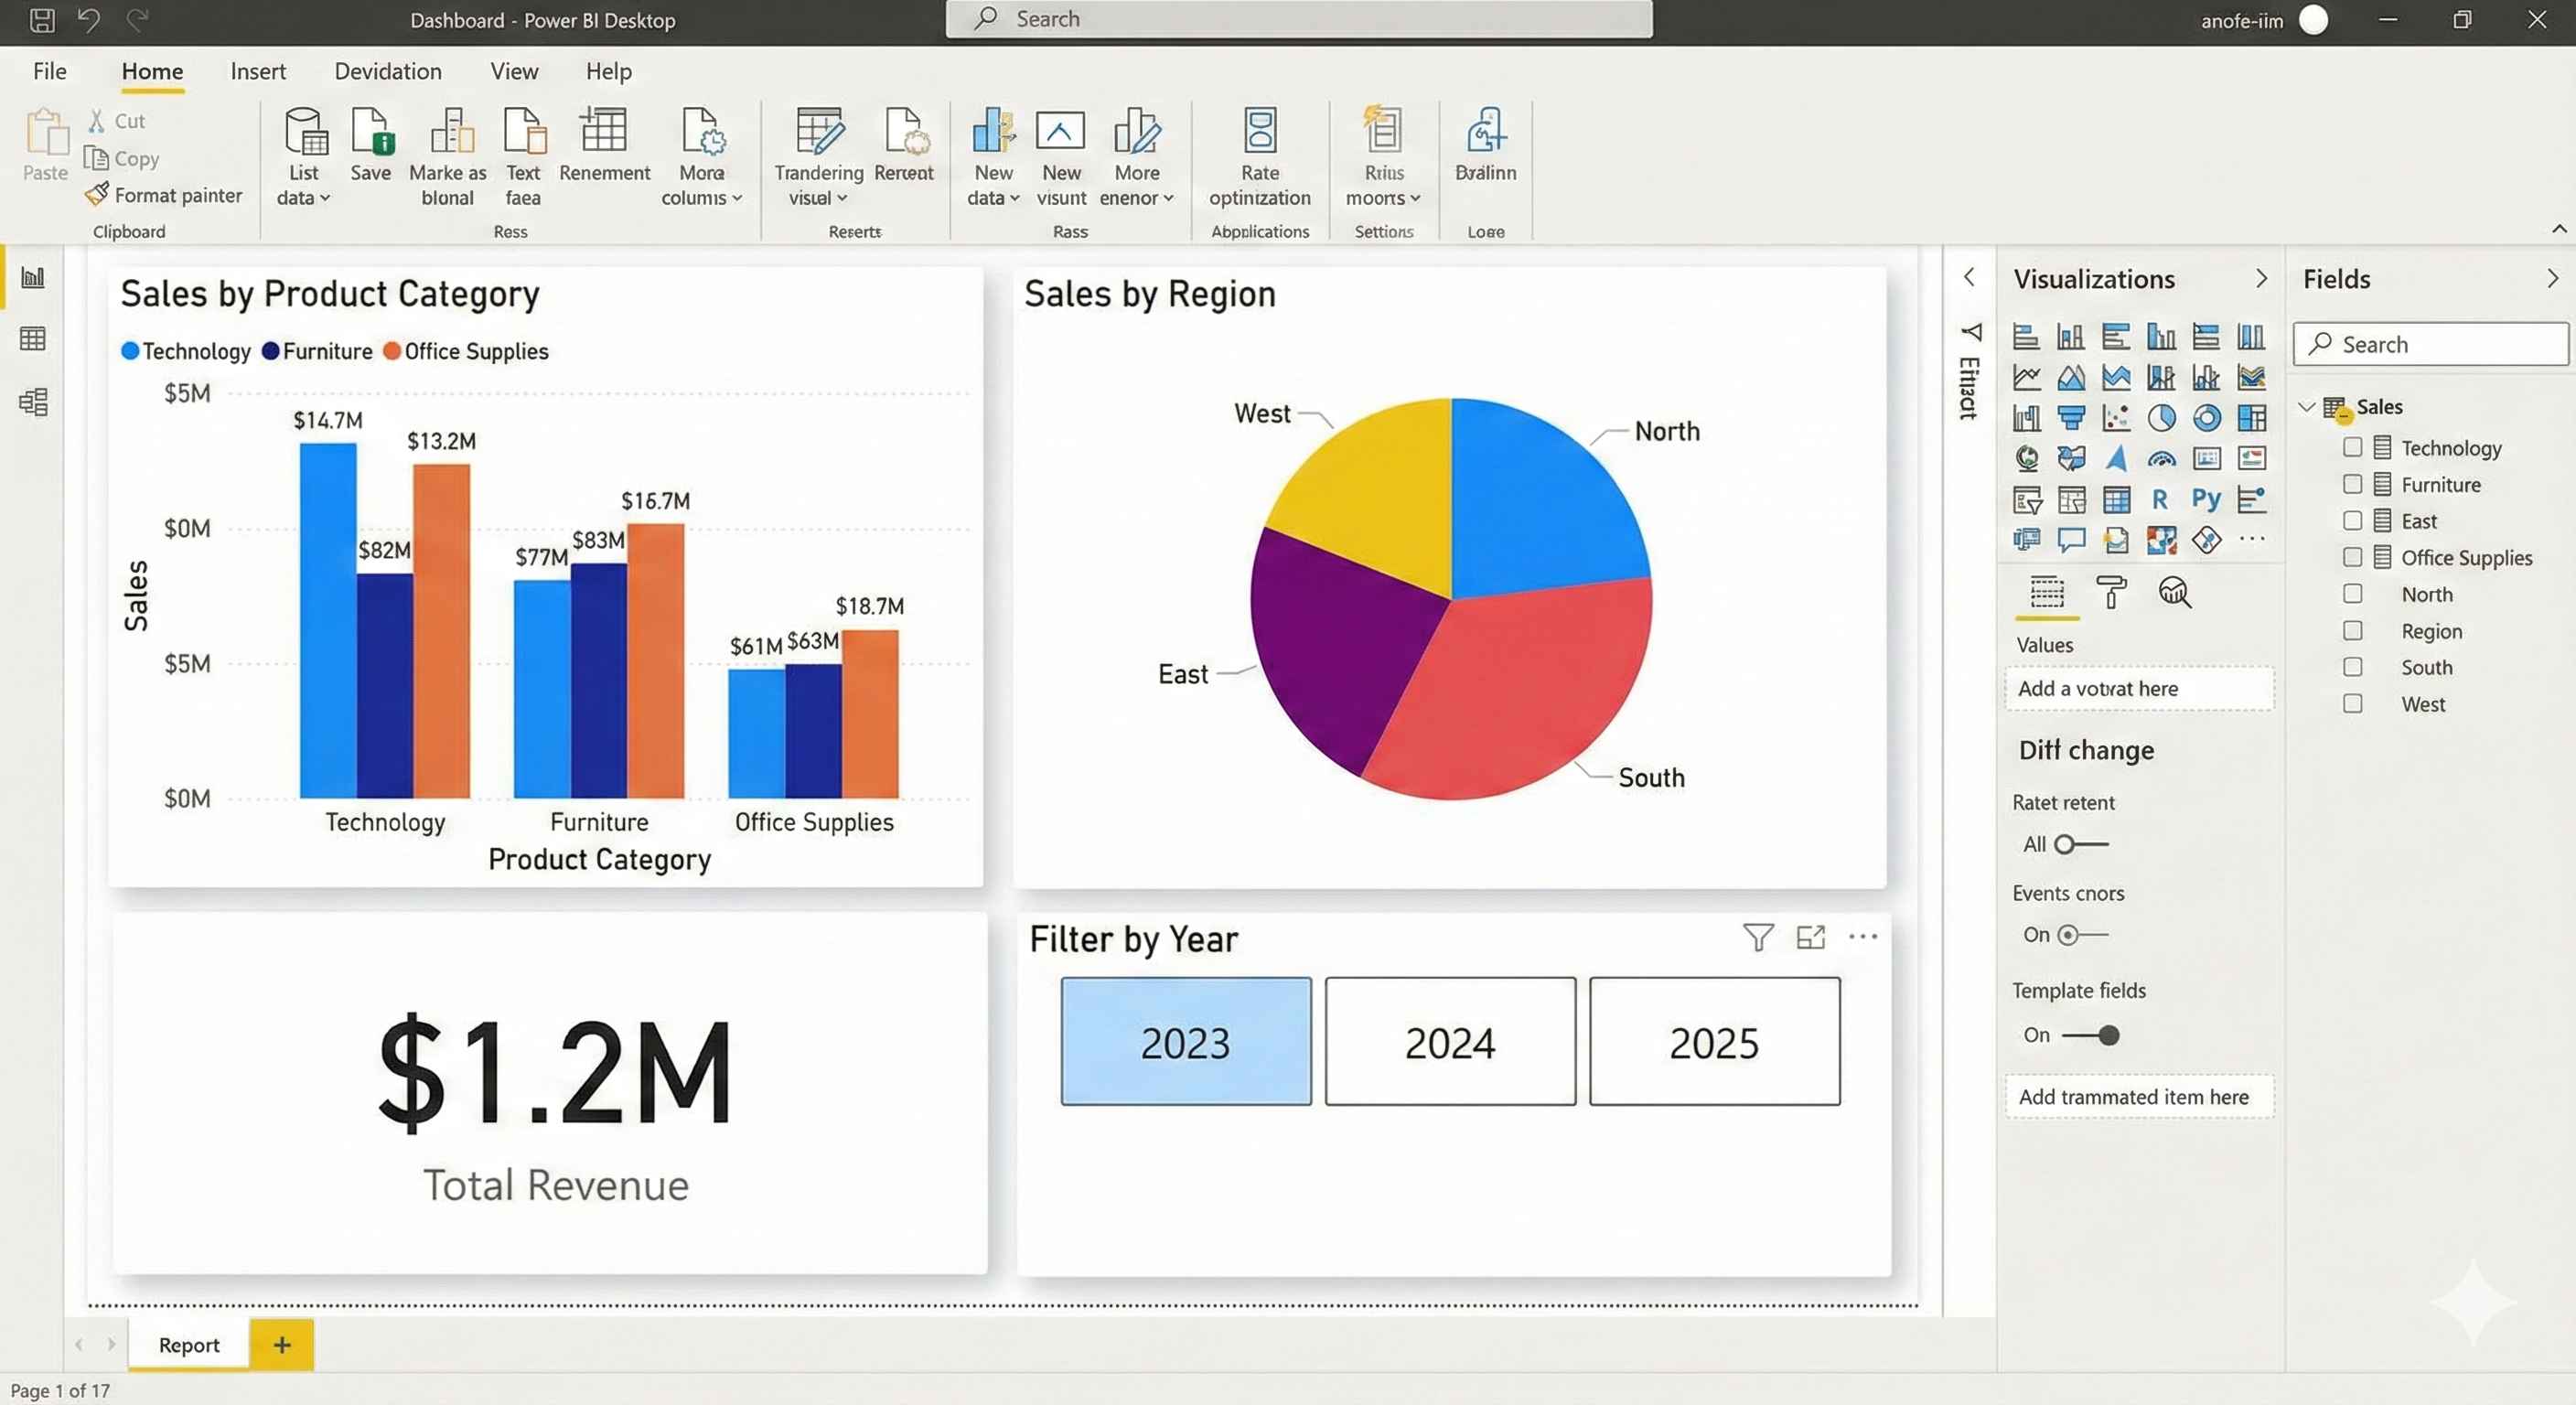
What You Built
| Visual | Shows |
|---|---|
| Bar Chart | Sales by Product |
| Pie Chart | Sales by Country |
| Card | Total Sales |
| Slicer | Filter by Segment |
Try This
Click on any bar in your chart - notice how other visuals update. This is called cross-filtering.
You just built your first Power BI dashboard! Save it and experiment with different chart types.