Financial Model - Phase 1: Setup & Inputs
Set up your workbook structure and create the inputs control panel
Financial Model Project - Phase 1: Setup & Inputs
Welcome to your real-world Excel project! 🎉 You're building a complete financial forecasting model that businesses actually use.
Project Overview
You'll build a professional financial model across 4 phases:
🔵 Phase 1 (You are here): Setup & Inputs - Foundation and control panel
- Phase 2: Calculations Engine - Revenue, expenses, profit formulas
- Phase 3: Analysis & Metrics - Break-even, summaries, trends
- Phase 4: Dashboard & Polish - Visual dashboard and protection
What You'll Build in Phase 1
By the end of this phase, you'll have:
- A professionally organized 3-sheet workbook
- A complete inputs control panel
- All business assumptions in one place
- Proper formatting and structure
Time needed: 20-30 minutes
Meet Sarah's Bakery
Real-World Context: Sarah is starting an online bakery. Before investing $10,000 of her savings, she needs to know:
- "Will I be profitable?"
- "When will I break even?"
- "Can I afford to hire help in 6 months?"
You're building the financial model that will answer these questions.
Phase 1 Roadmap
| Step | What You'll Do | Time |
|---|---|---|
| 1 | Create & organize workbook structure | 5 min |
| 2 | Build business information section | 3 min |
| 3 | Set up revenue assumptions | 5 min |
| 4 | Set up expense assumptions | 5 min |
| 5 | Format and validate inputs | 5 min |
Step 1: Create Your Workbook Structure
Let's build a professional foundation.
Why 3 sheets? This is industry standard:
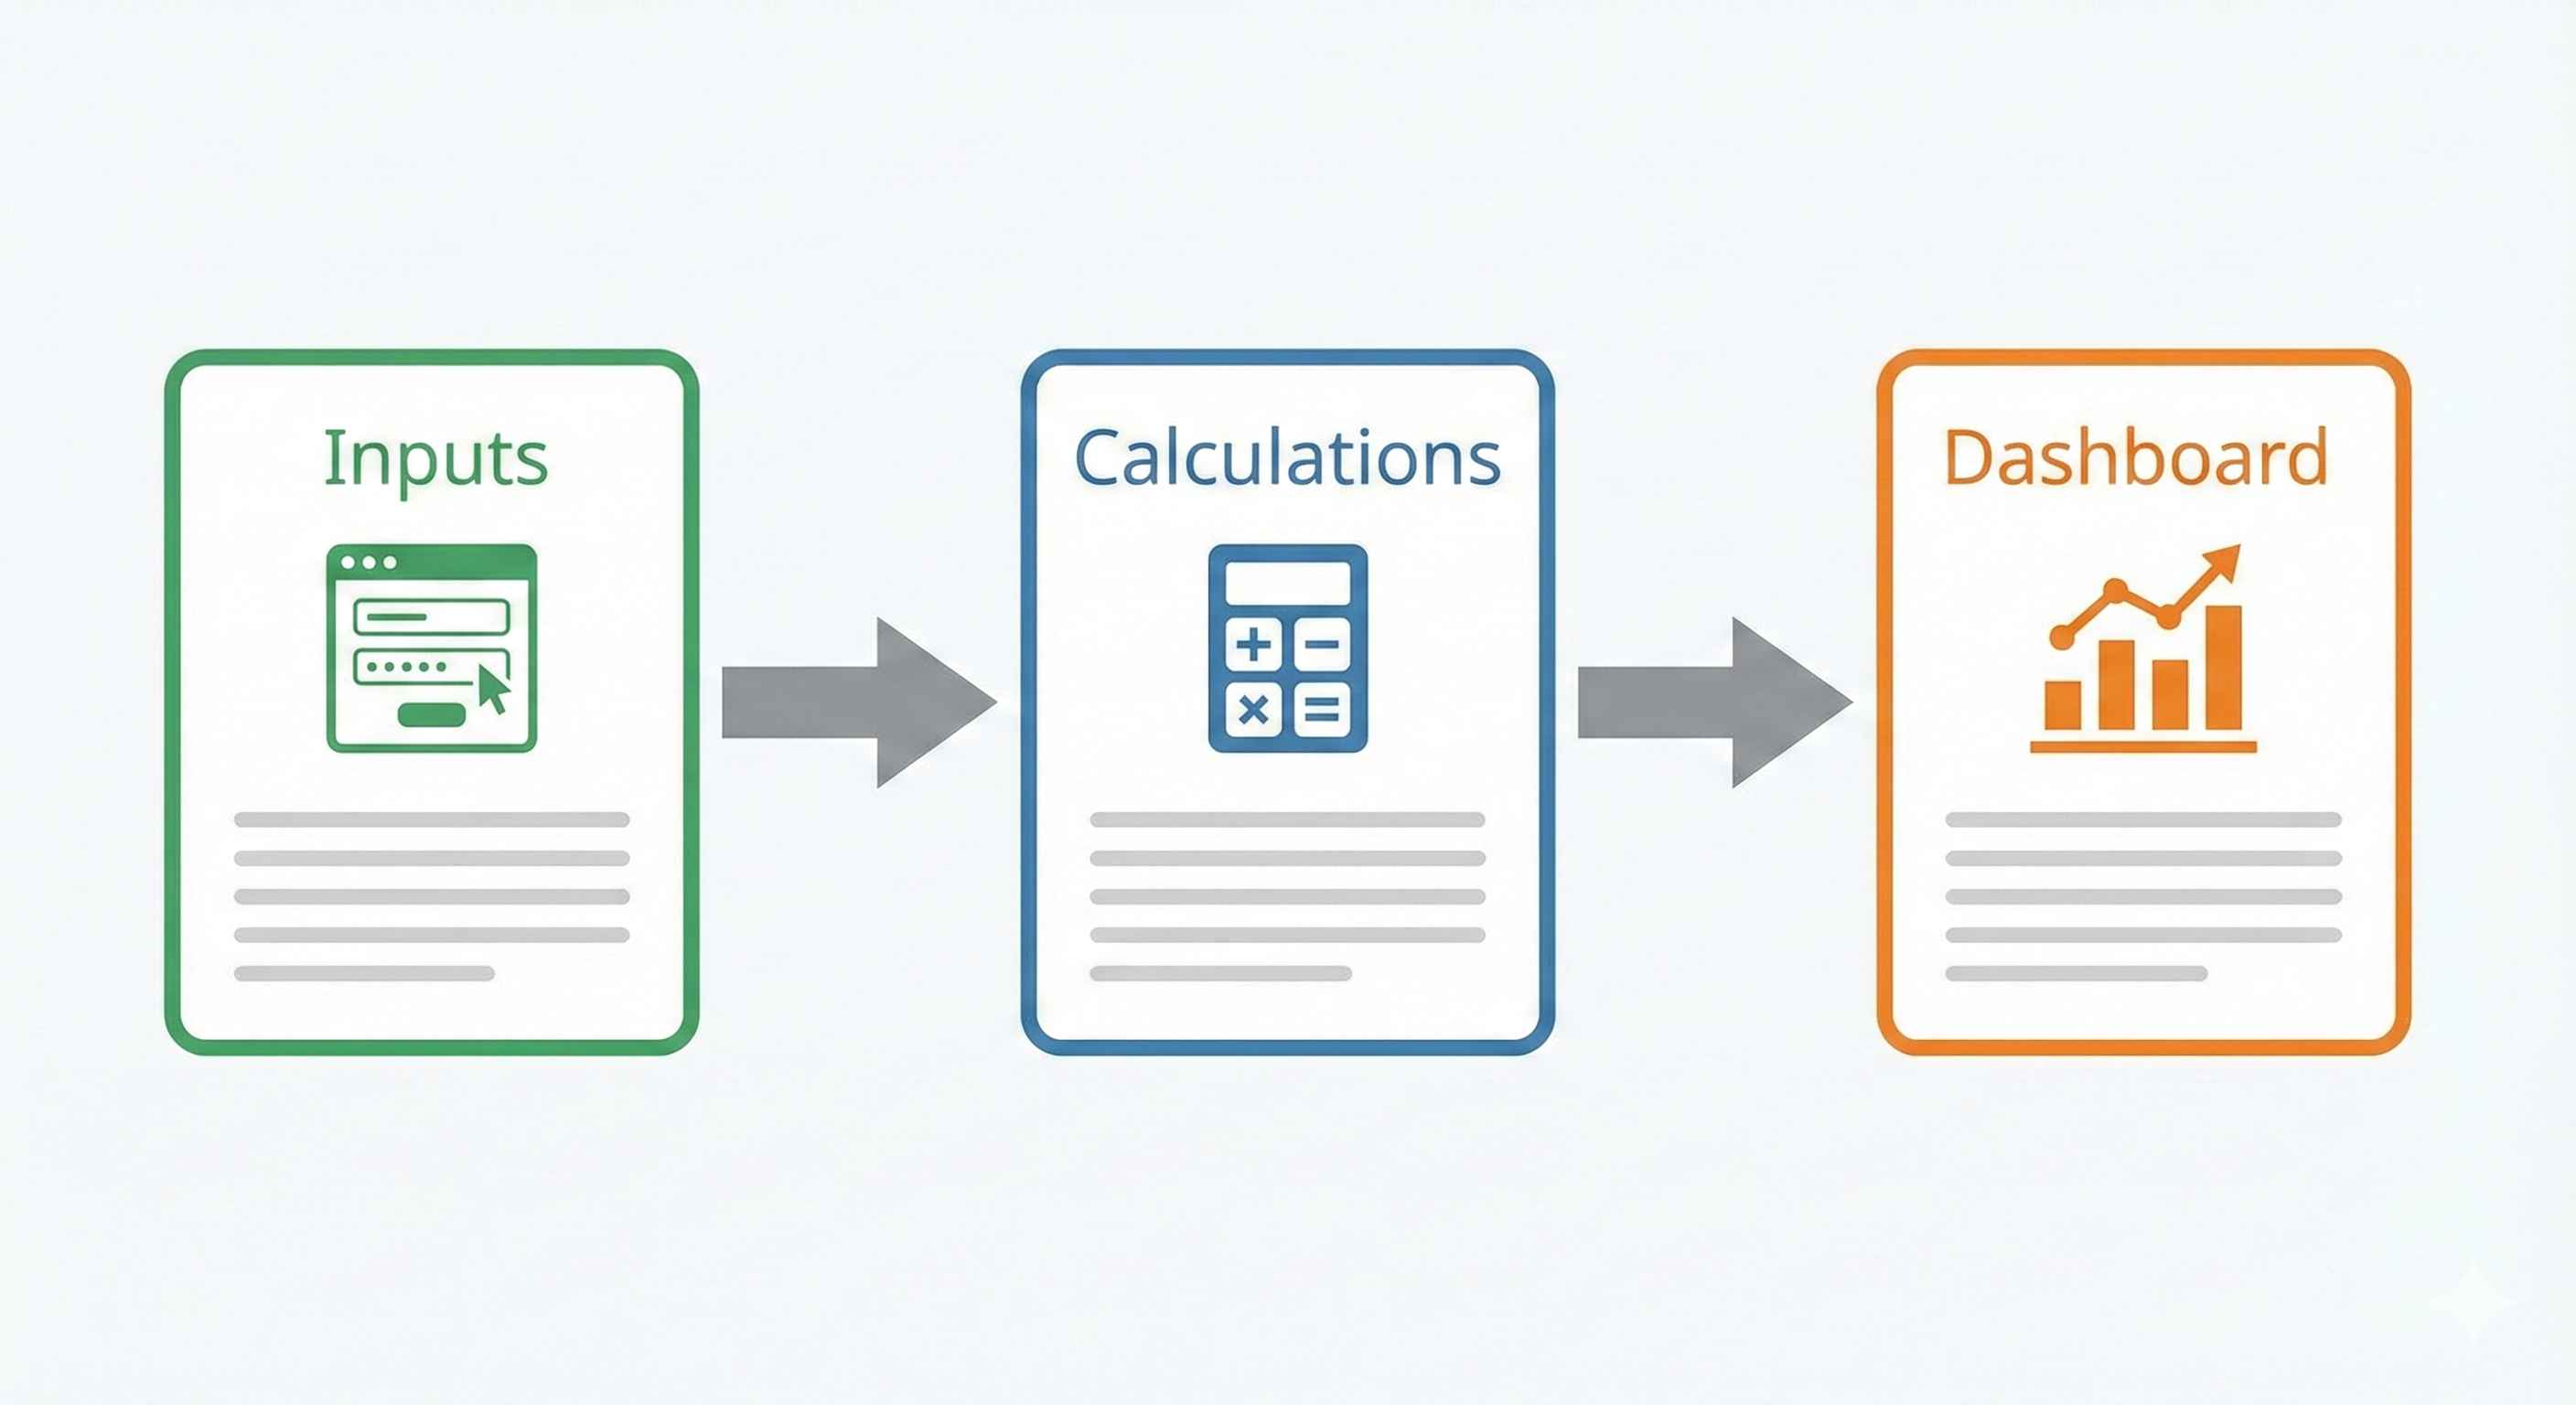
- Inputs = All assumptions (what you change)
- Calculations = All formulas (the engine)
- Dashboard = Visual summary (what you show)
Welcome to your first real-world Excel project! 🎉
You're going to build a complete financial model that businesses actually use to plan their finances.
What You'll Build
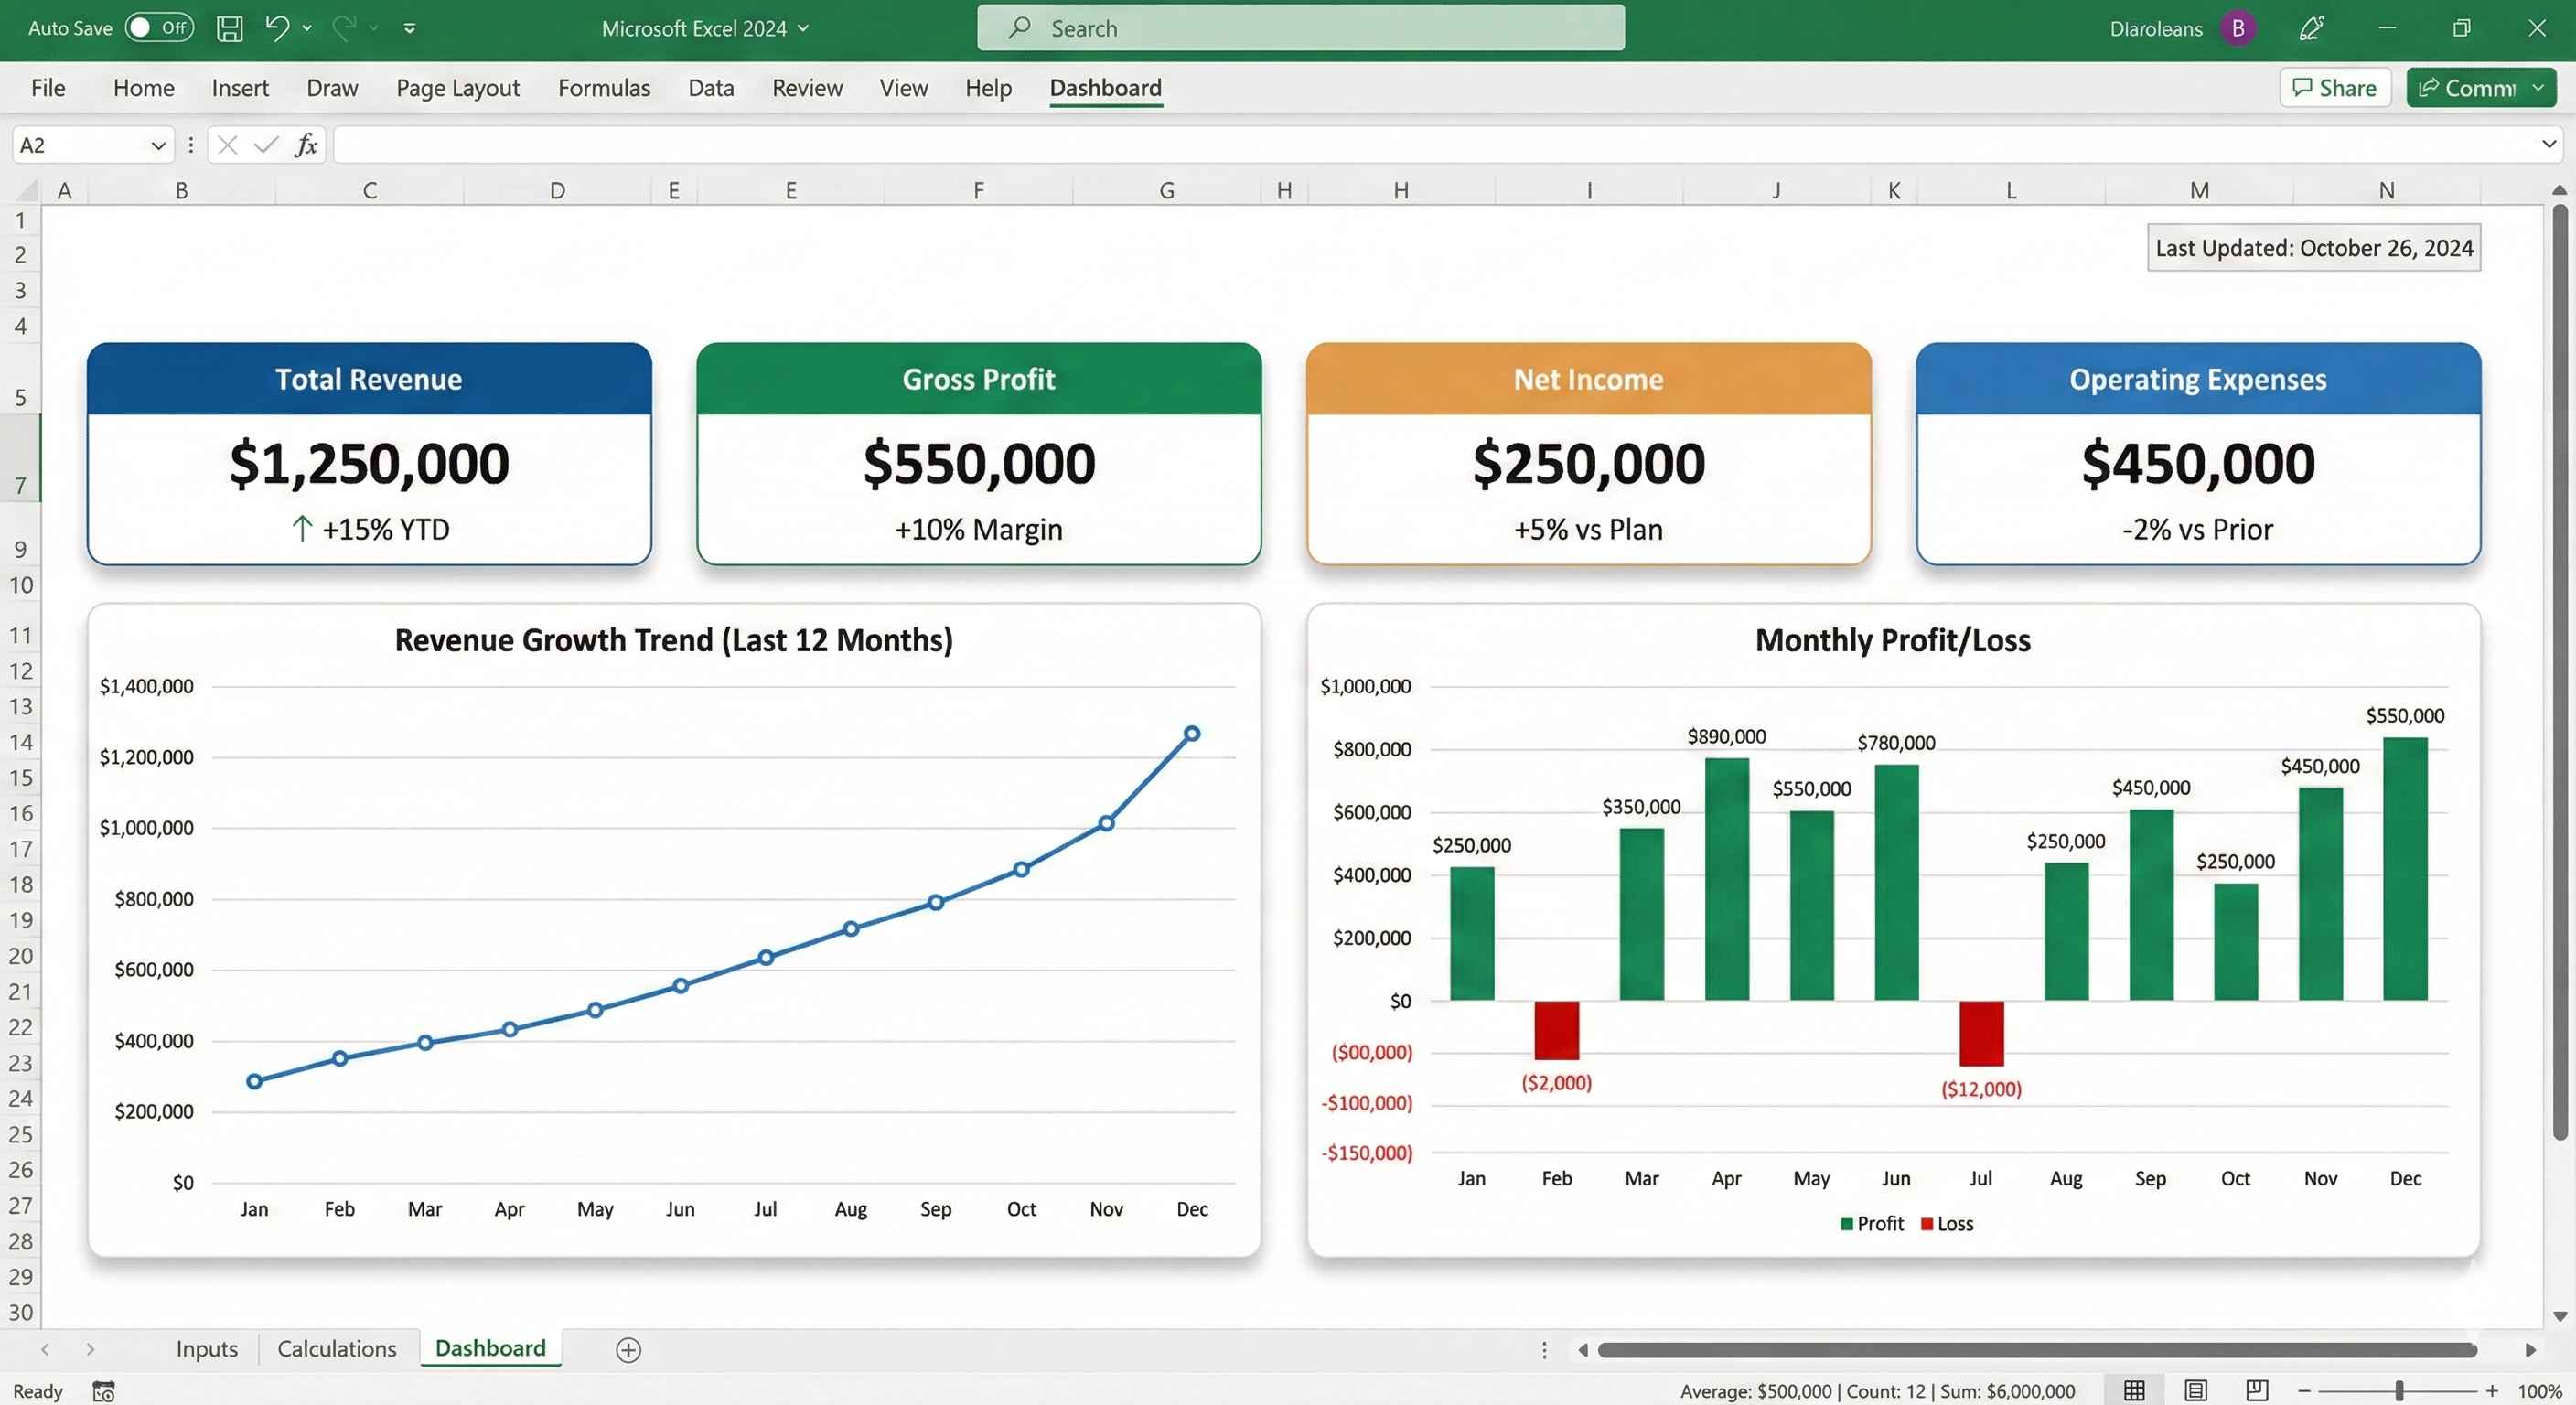
By the end of this project, you'll have a professional financial model that shows:
- Monthly revenue projections for 12 months
- Expense tracking across multiple categories
- Profit & Loss statement that updates automatically
- Break-even analysis to know when you become profitable
- Visual dashboard with charts showing your financial health
This is the exact type of spreadsheet that:
- Startups show to investors
- Small businesses use for planning
- Freelancers use to manage income
- Students use for business plan projects
Real-World Use Case
Meet Sarah: She's starting a small online bakery. Before investing her savings, she needs to answer:
- "How much revenue do I need to break even?"
- "When will I become profitable?"
- "Can I afford to hire help in month 6?"
This financial model will answer all these questions. You'll build Sarah's model, but you can adapt it for ANY business.
What You'll Learn
✅ Setting up a professional workbook structure ✅ Building formulas that reference other sheets ✅ Using named ranges for cleaner formulas ✅ Creating dropdown lists for scenarios ✅ Conditional formatting to highlight problems ✅ Building charts that update automatically ✅ Protecting your work while allowing inputs
Prerequisites: You should have completed Modules 1-3. You need to know:
- Basic formulas (SUM, AVERAGE)
- Cell references (relative and absolute)
- IF statements
- Basic formatting
Time needed: 60-90 minutes (take breaks!)
Project Overview: The Structure
Our financial model will have 3 sheets:
- Inputs - Where we enter assumptions (prices, costs, growth rates)
- Calculations - Where all the math happens (revenue, expenses, profit)
- Dashboard - Visual summary with charts and key metrics
Step 1: Set Up Your Workbook
Let's create a clean, organized workbook.
Why this matters: Professional models are organized. Anyone should be able to open your file and understand it immediately.
Instructions:
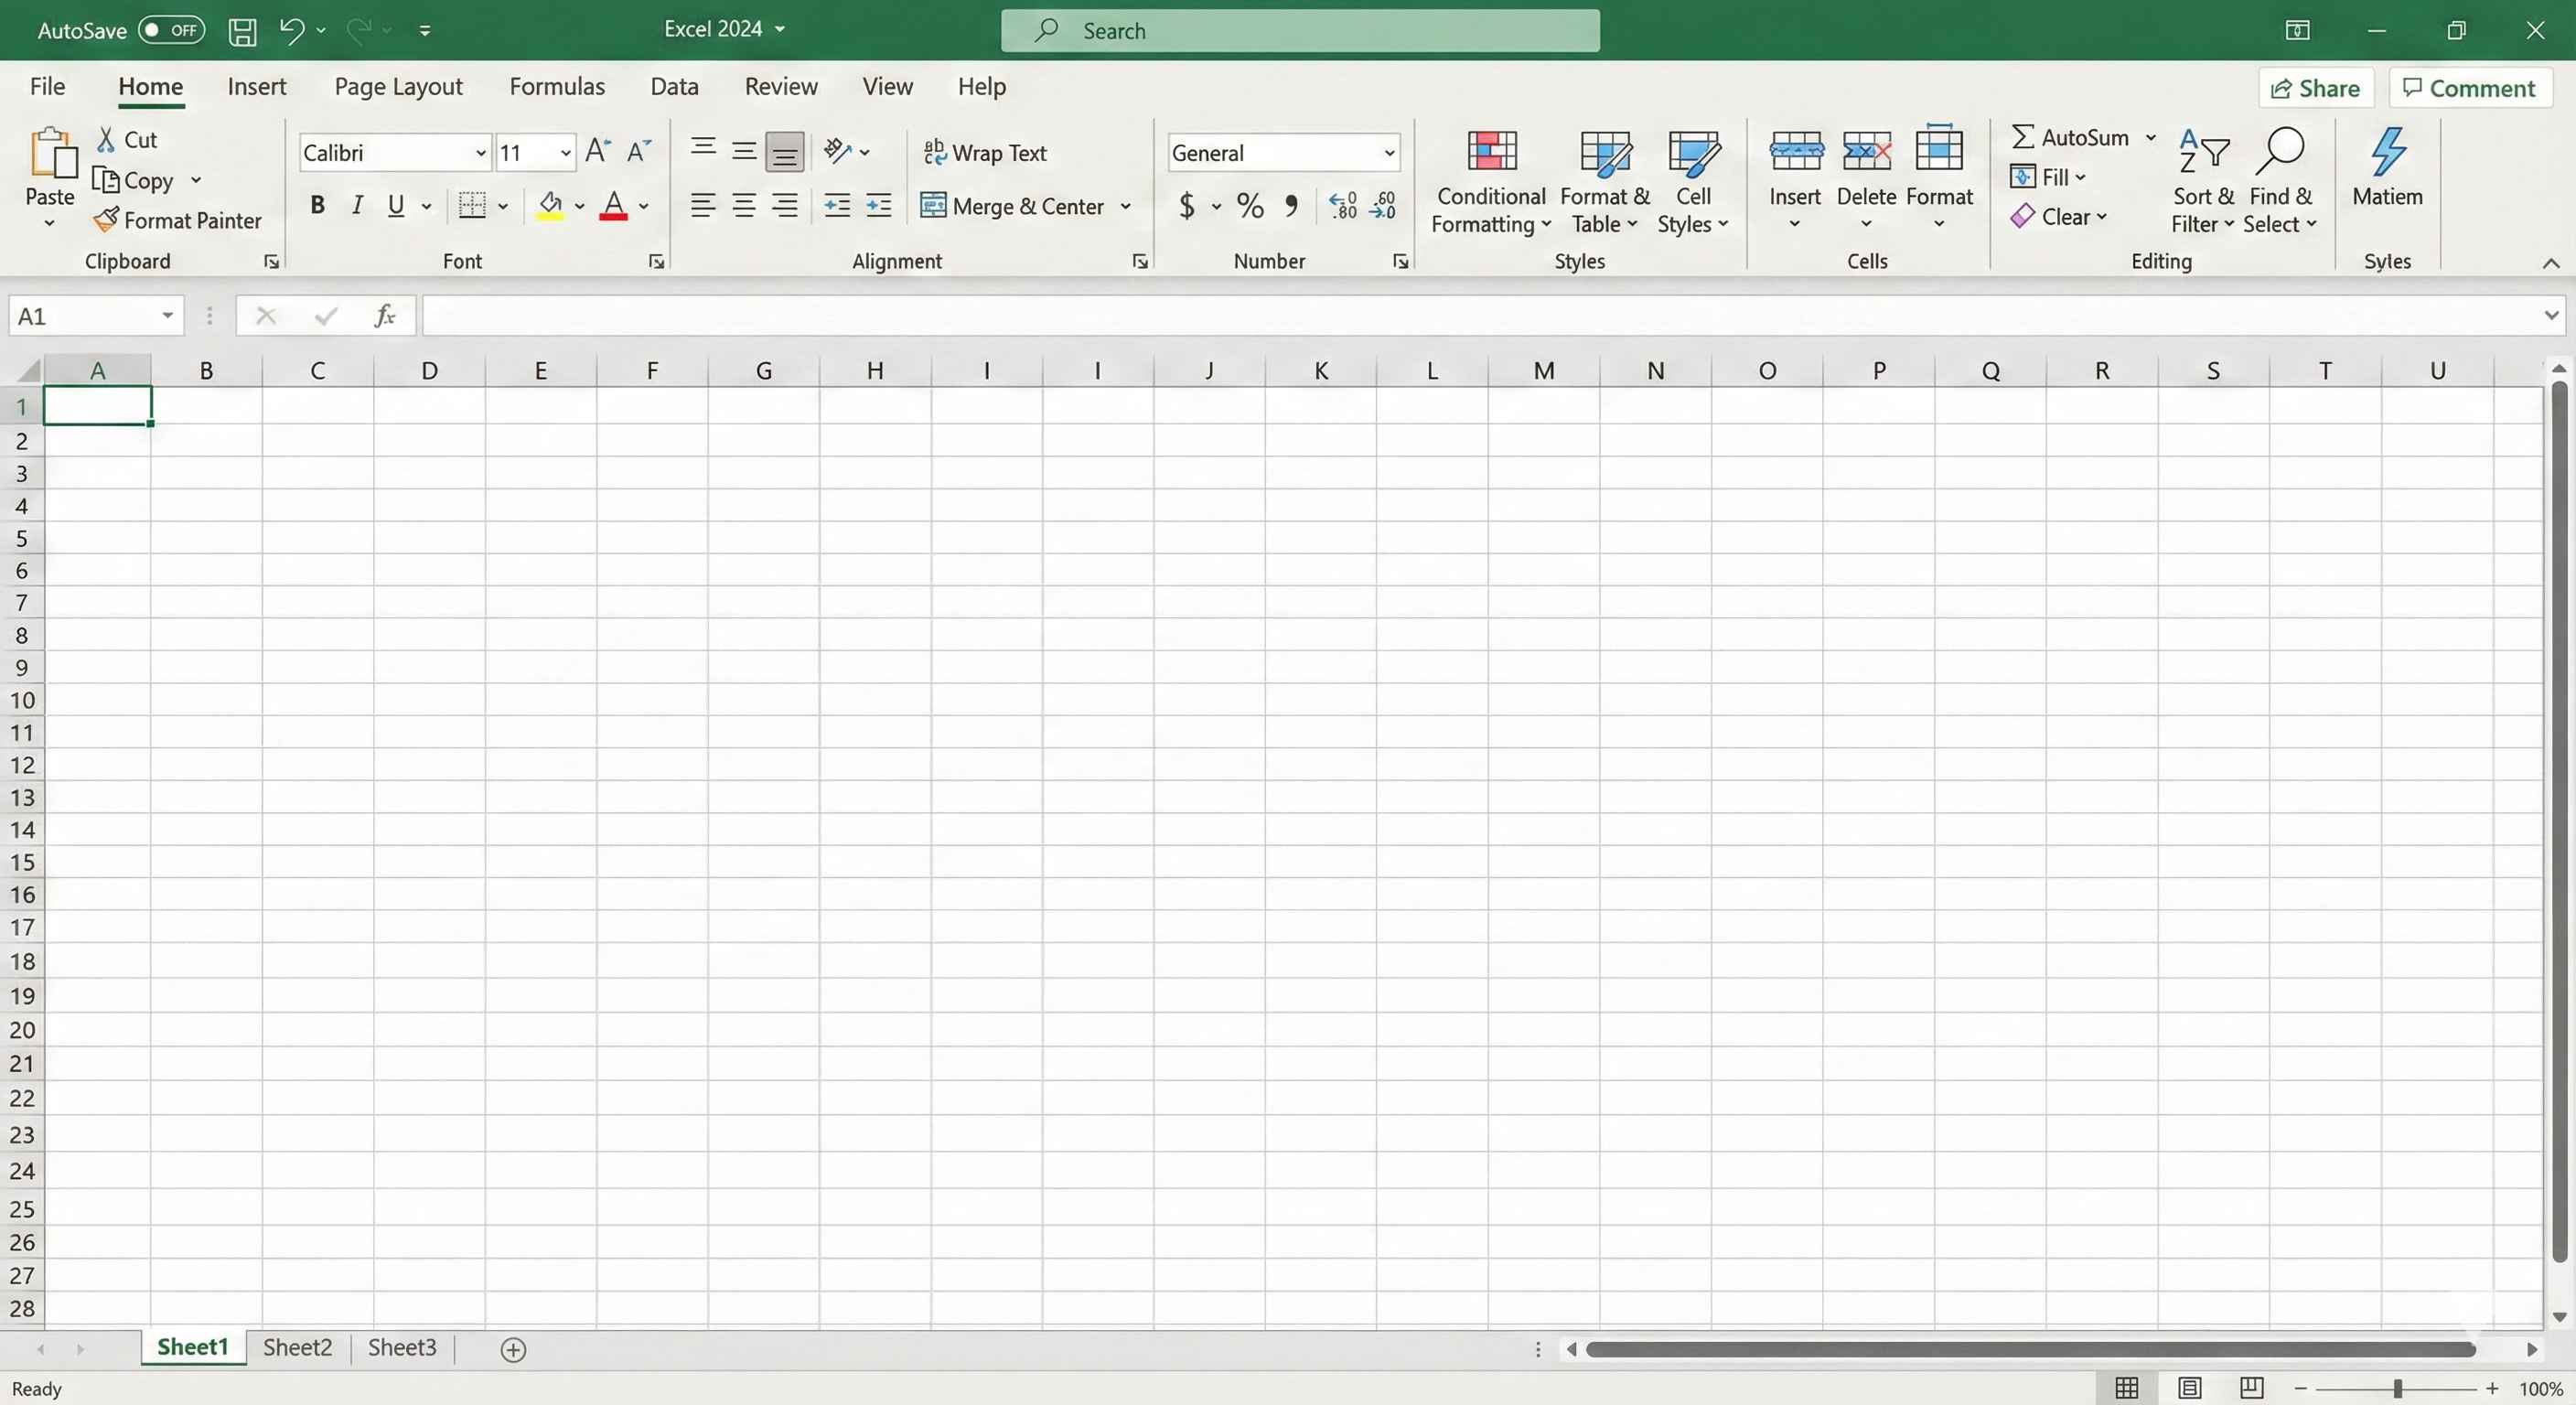
- Open Excel and create a New Blank Workbook
- Save it as "Financial_Model_2024.xlsx" (Ctrl + S)
- You see three sheet tabs at the bottom: Sheet1, Sheet2, Sheet3
-
Rename the sheets:
- Double-click "Sheet1" tab
- Type: Inputs
- Press Enter
- Repeat for "Sheet2" → name it Calculations
- Repeat for "Sheet3" → name it Dashboard
-
Color-code your tabs:
- Right-click "Inputs" tab → Tab Color → Green
- Right-click "Calculations" tab → Tab Color → Blue
- Right-click "Dashboard" tab → Tab Color → Orange
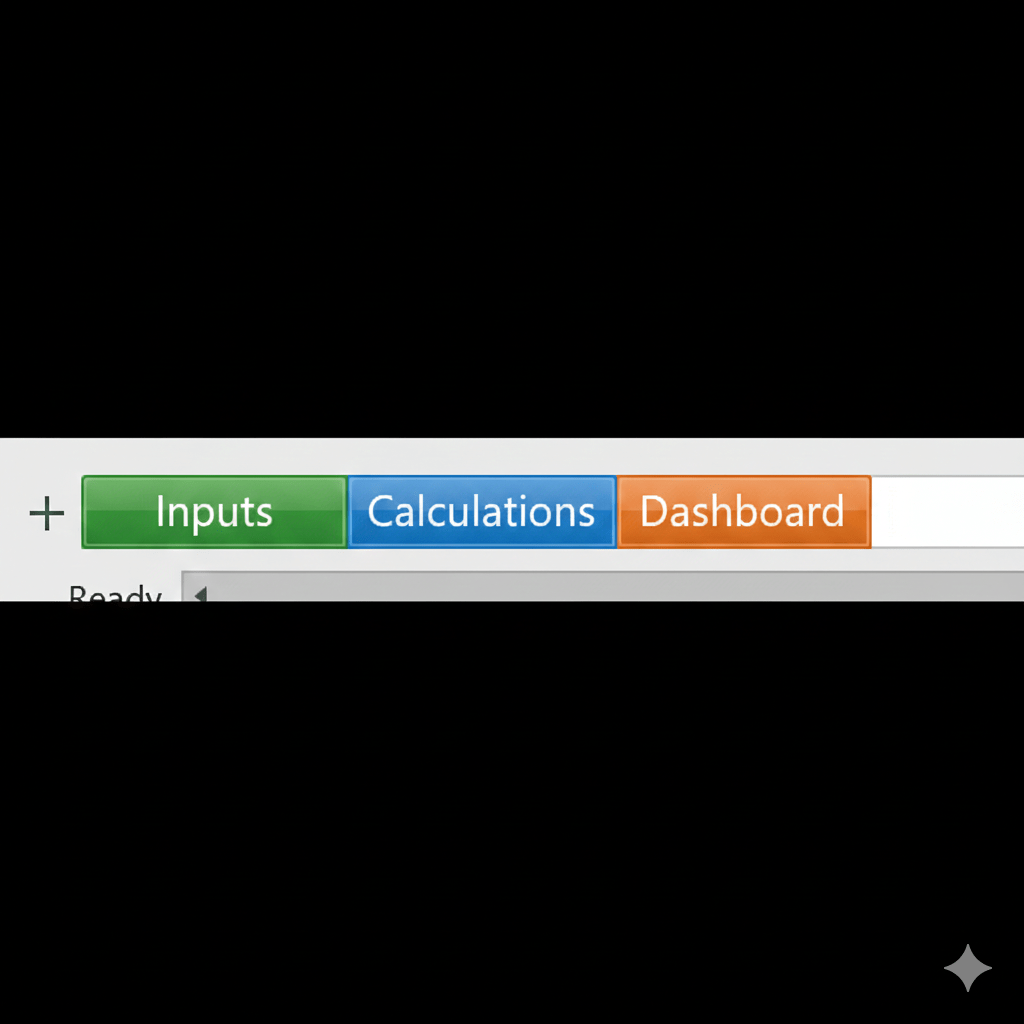
✓ Checkpoint: You should see three colored tabs: Inputs (green), Calculations (blue), Dashboard (orange)
Step 2: Build the Inputs Sheet
This is your control panel. All assumptions go here.
Why this matters: By putting all assumptions in one place, you can easily change scenarios. Want to see "What if I charge $5 more?" Just change one cell!
Instructions:
- Click the Inputs tab
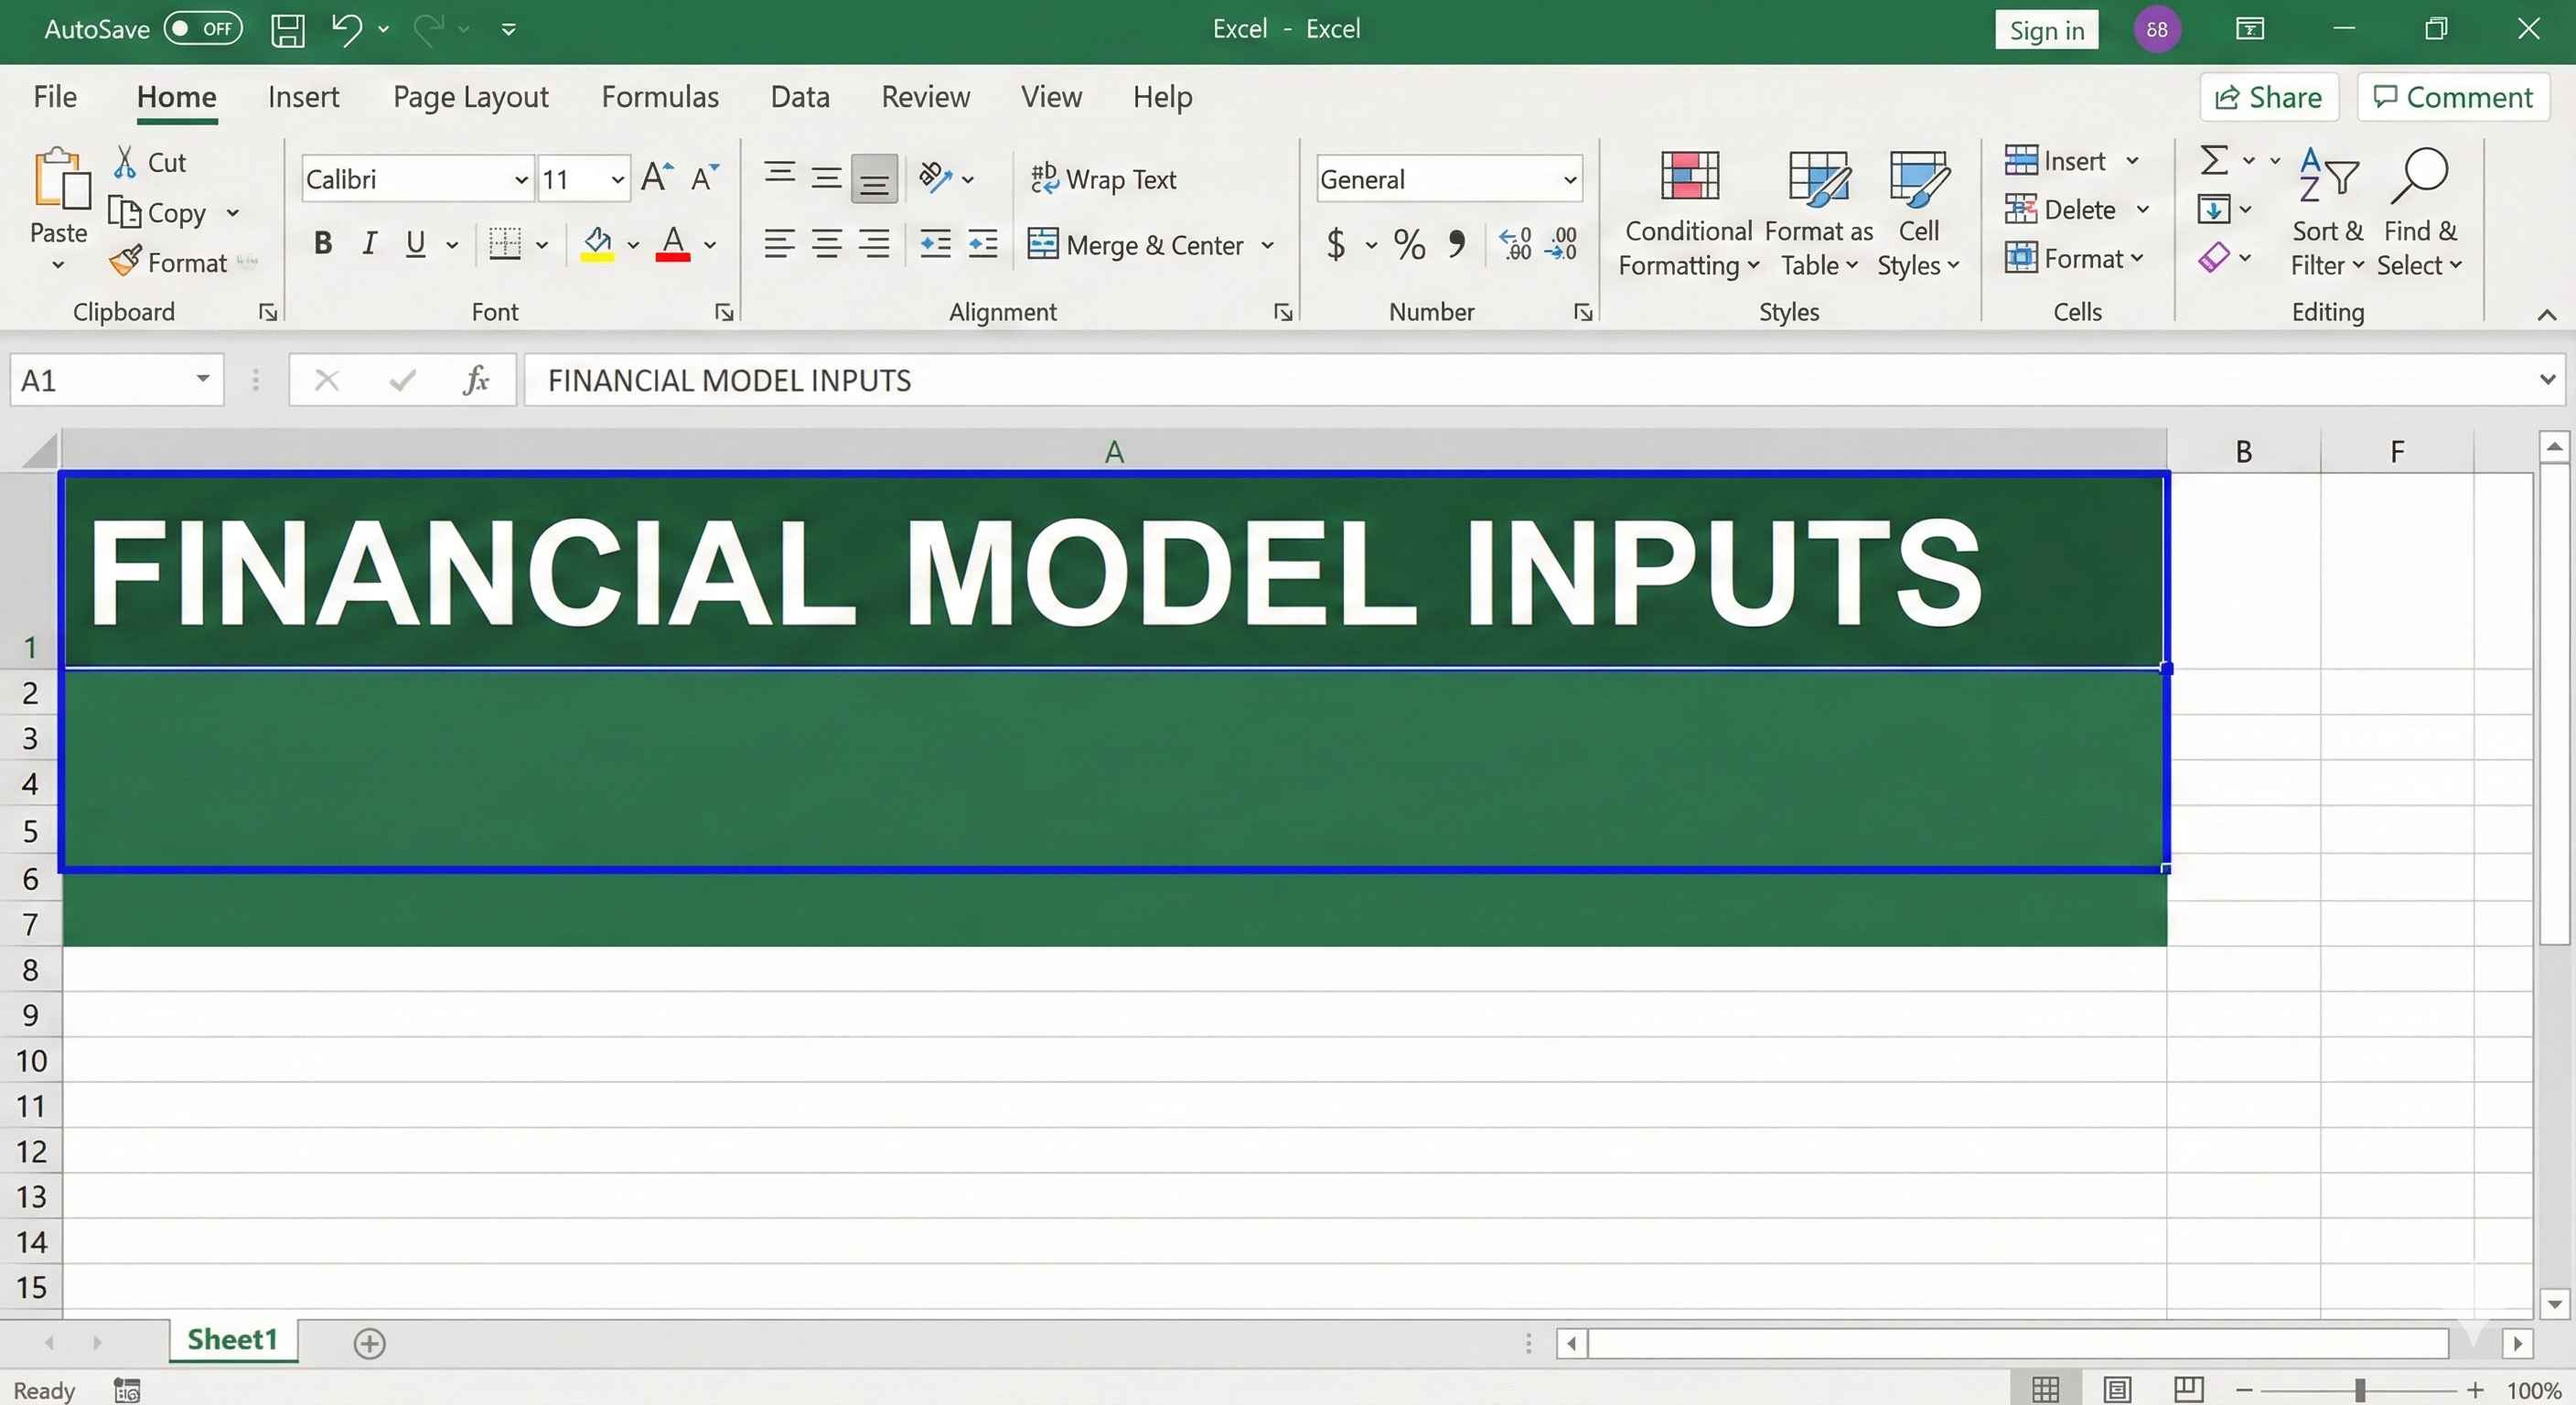
- In cell A1, type: FINANCIAL MODEL INPUTS
- Make it look professional:
- Select A1
- Font size: 16
- Bold (Ctrl + B)
- Fill color: Dark green
- Font color: White
- Add section headers (Type these exactly):
| Cell | Type This | Description |
|---|---|---|
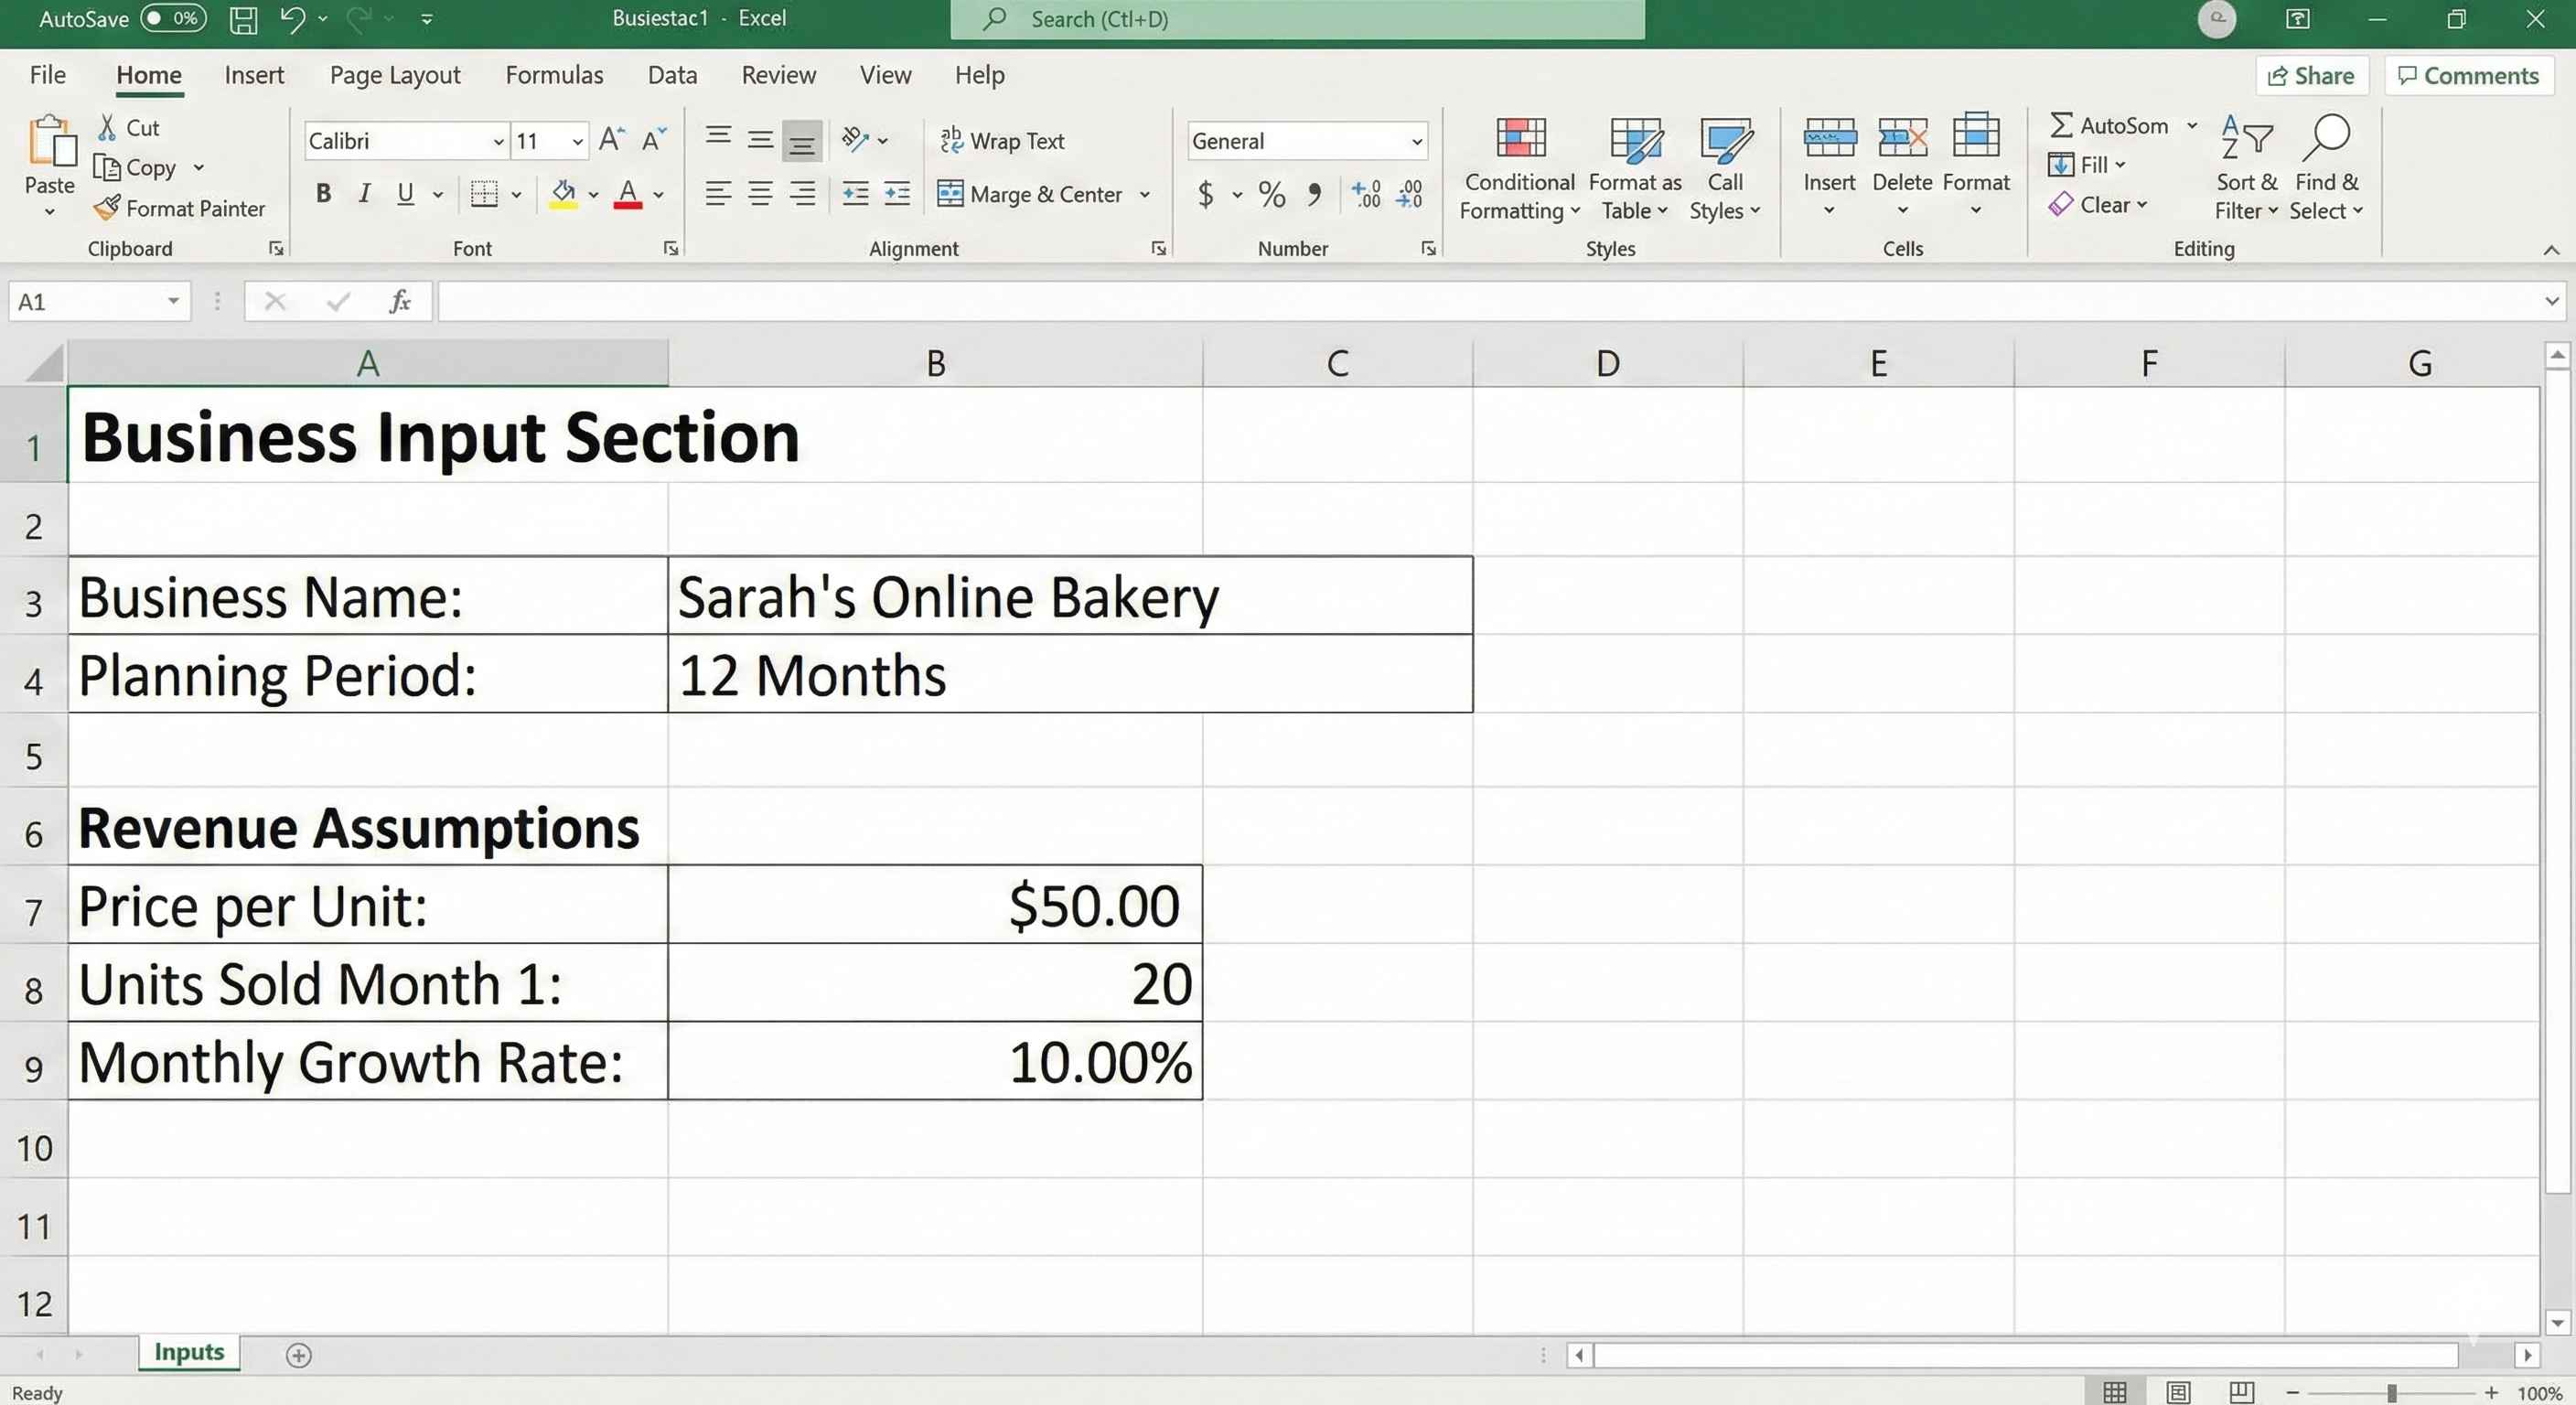
| A3 | Business Information | Section 1 |
| A4 | Business Name: | Label |
| B4 | Sarah's Online Bakery | Your business name |
| A5 | Planning Period: | Label |
| B5 | 12 Months | Time period |
| A7 | Revenue Assumptions | Section 2 |
| A8 | Product Name: | Label |
| B8 | Custom Cakes | Product |
| A9 | Price per Unit: | Label |
| B9 | 50 | Price in dollars |
| A10 | Units Sold Month 1: | Label |
| B10 | 20 | Starting quantity |
| A11 | Monthly Growth Rate: | Label |
| B11 | 10% | Growth percentage |
- Format the numbers:
- Select B9, press Ctrl + Shift + $ (currency format)
- Select B11, press Ctrl + Shift + % (percentage format)
- Add Expense Assumptions (continue in same sheet):
| Cell | Type This | Value |
|---|---|---|
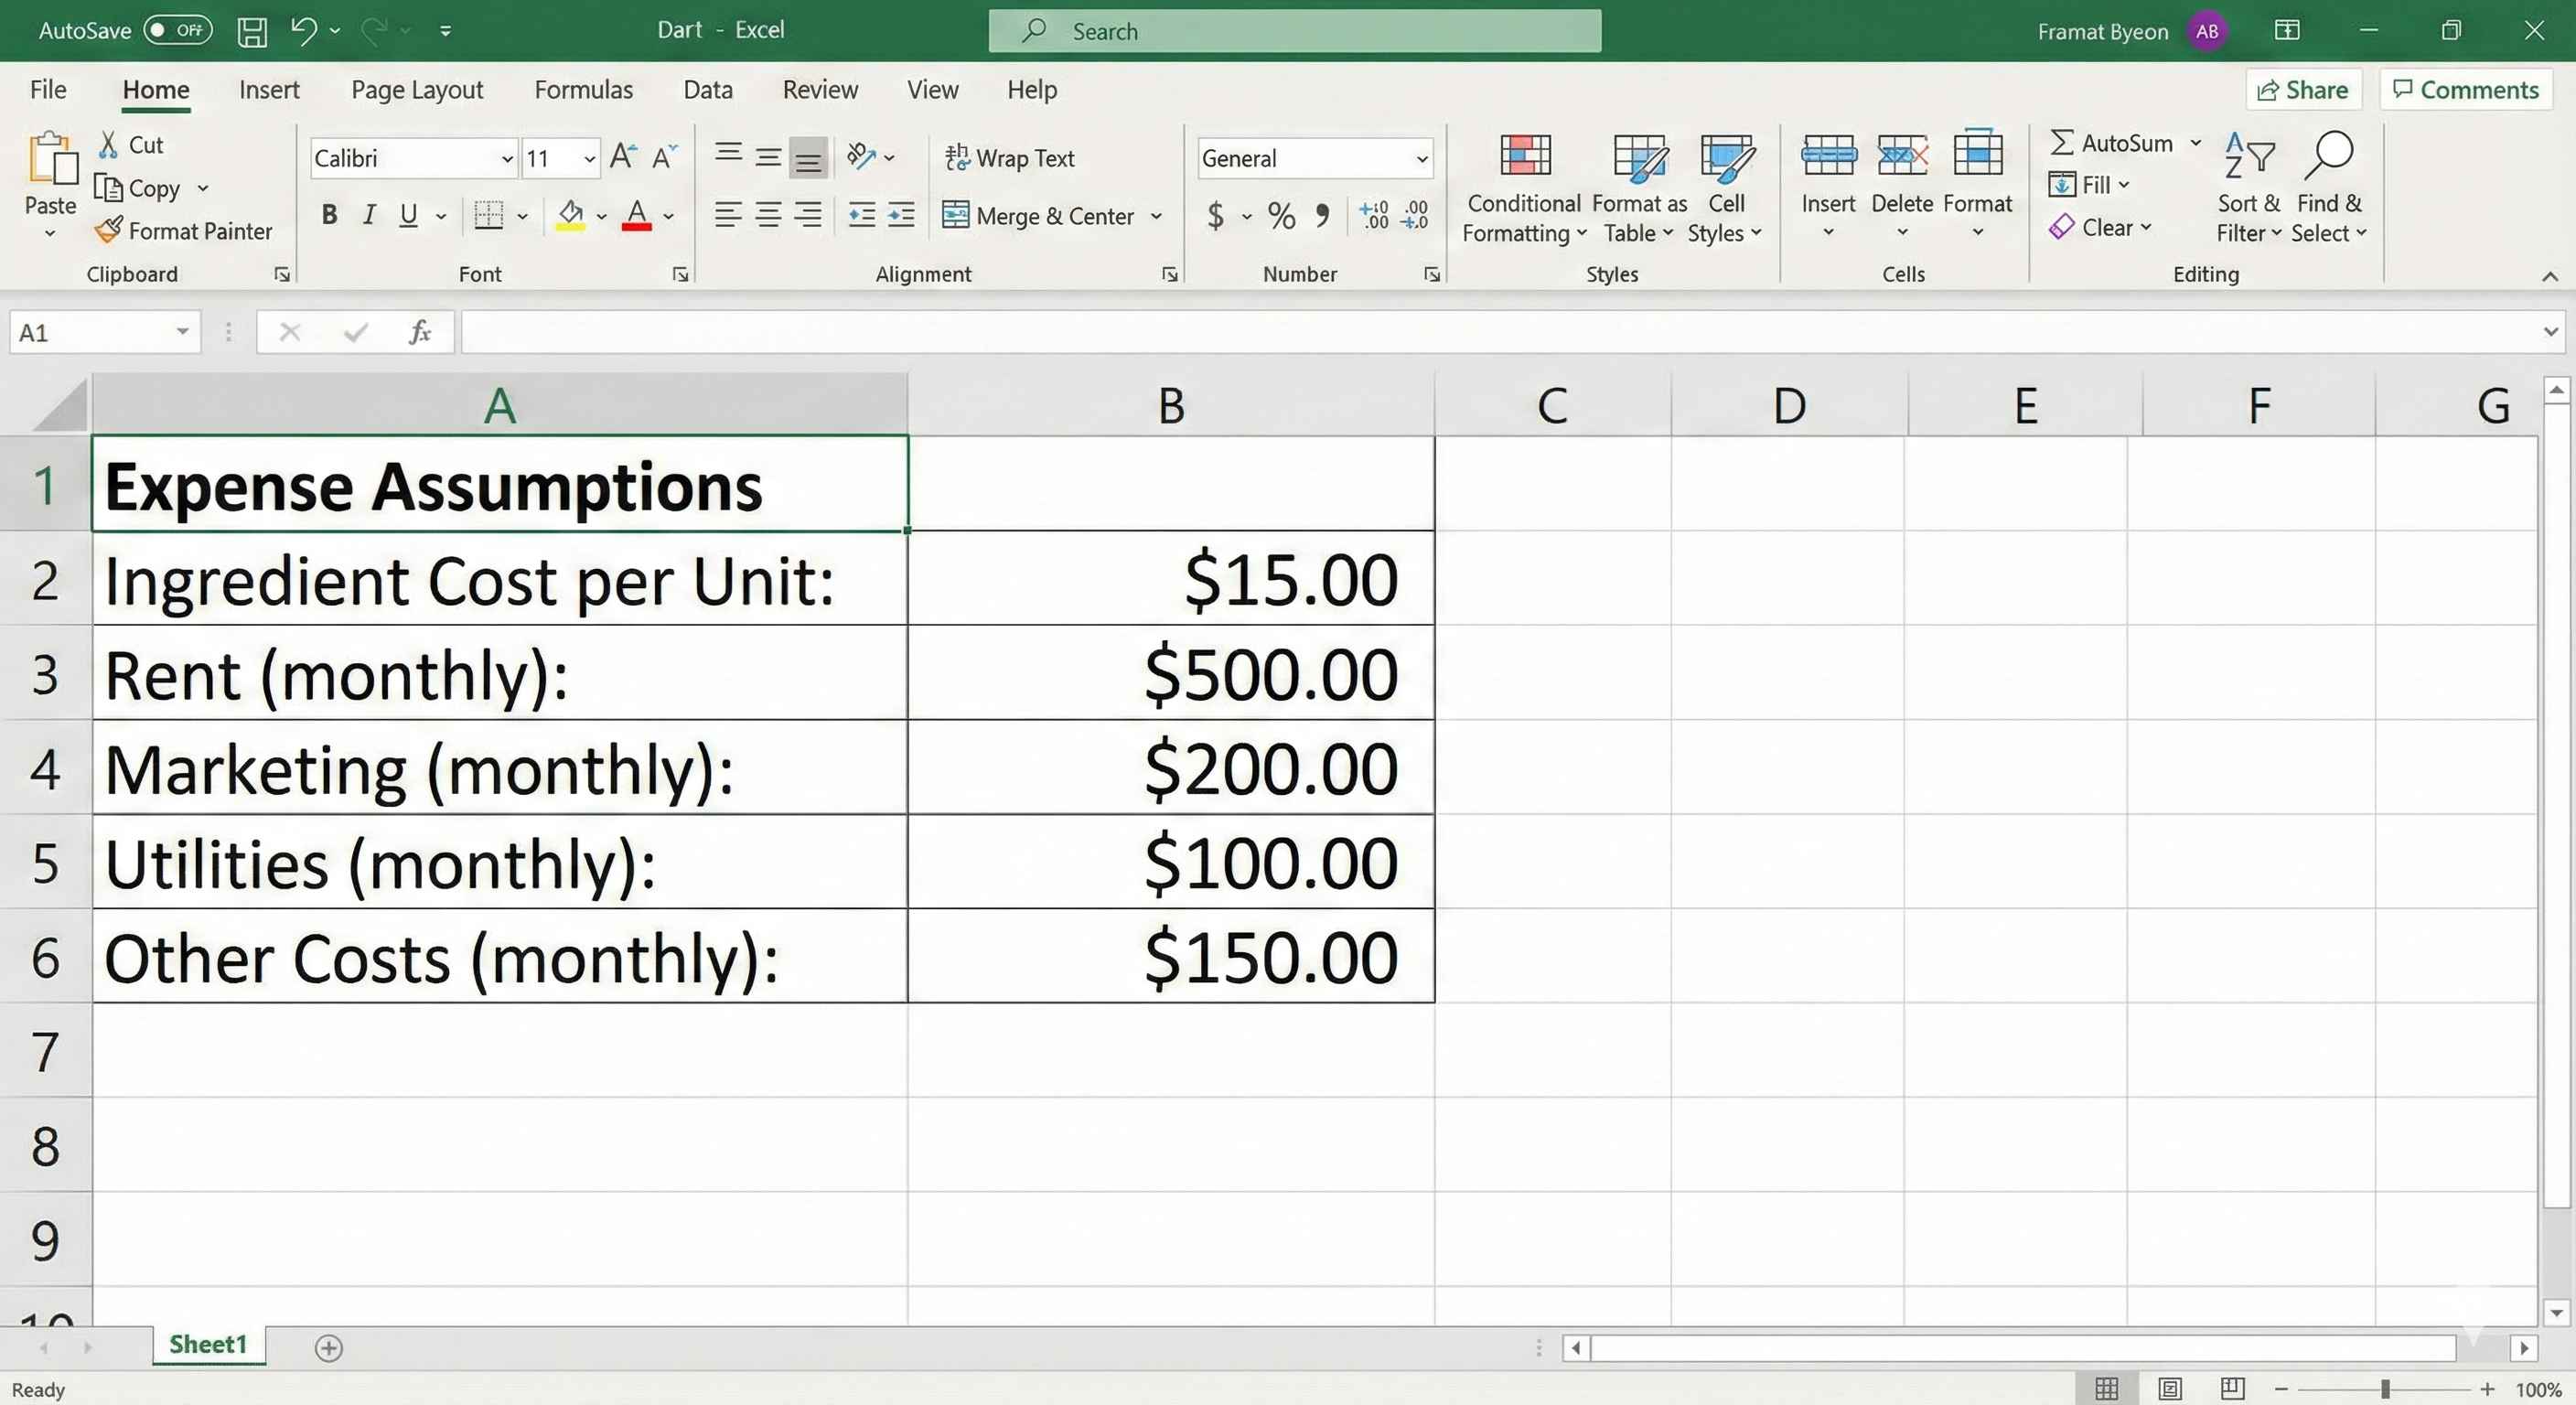
| A13 | Expense Assumptions | Section header |
| A14 | Ingredient Cost per Unit: | $15 |
| A15 | Rent (monthly): | $500 |
| A16 | Marketing (monthly): | $200 |
| A17 | Utilities (monthly): | $100 |
| A18 | Other Costs (monthly): | $150 |
Type the labels in column A, values in column B. Format B14 as currency.
✓ Checkpoint: Your Inputs sheet should have:
- Business info at top
- Revenue assumptions (rows 7-11)
- Expense assumptions (rows 13-18)
- All dollar amounts show $ sign
- Growth rate shows %