Interpreting Results
Read and understand regression output like a pro
What You'll Learn
- Reading regression output
- Understanding p-values
- Making predictions
- Avoiding common mistakes
Reading Regression Output
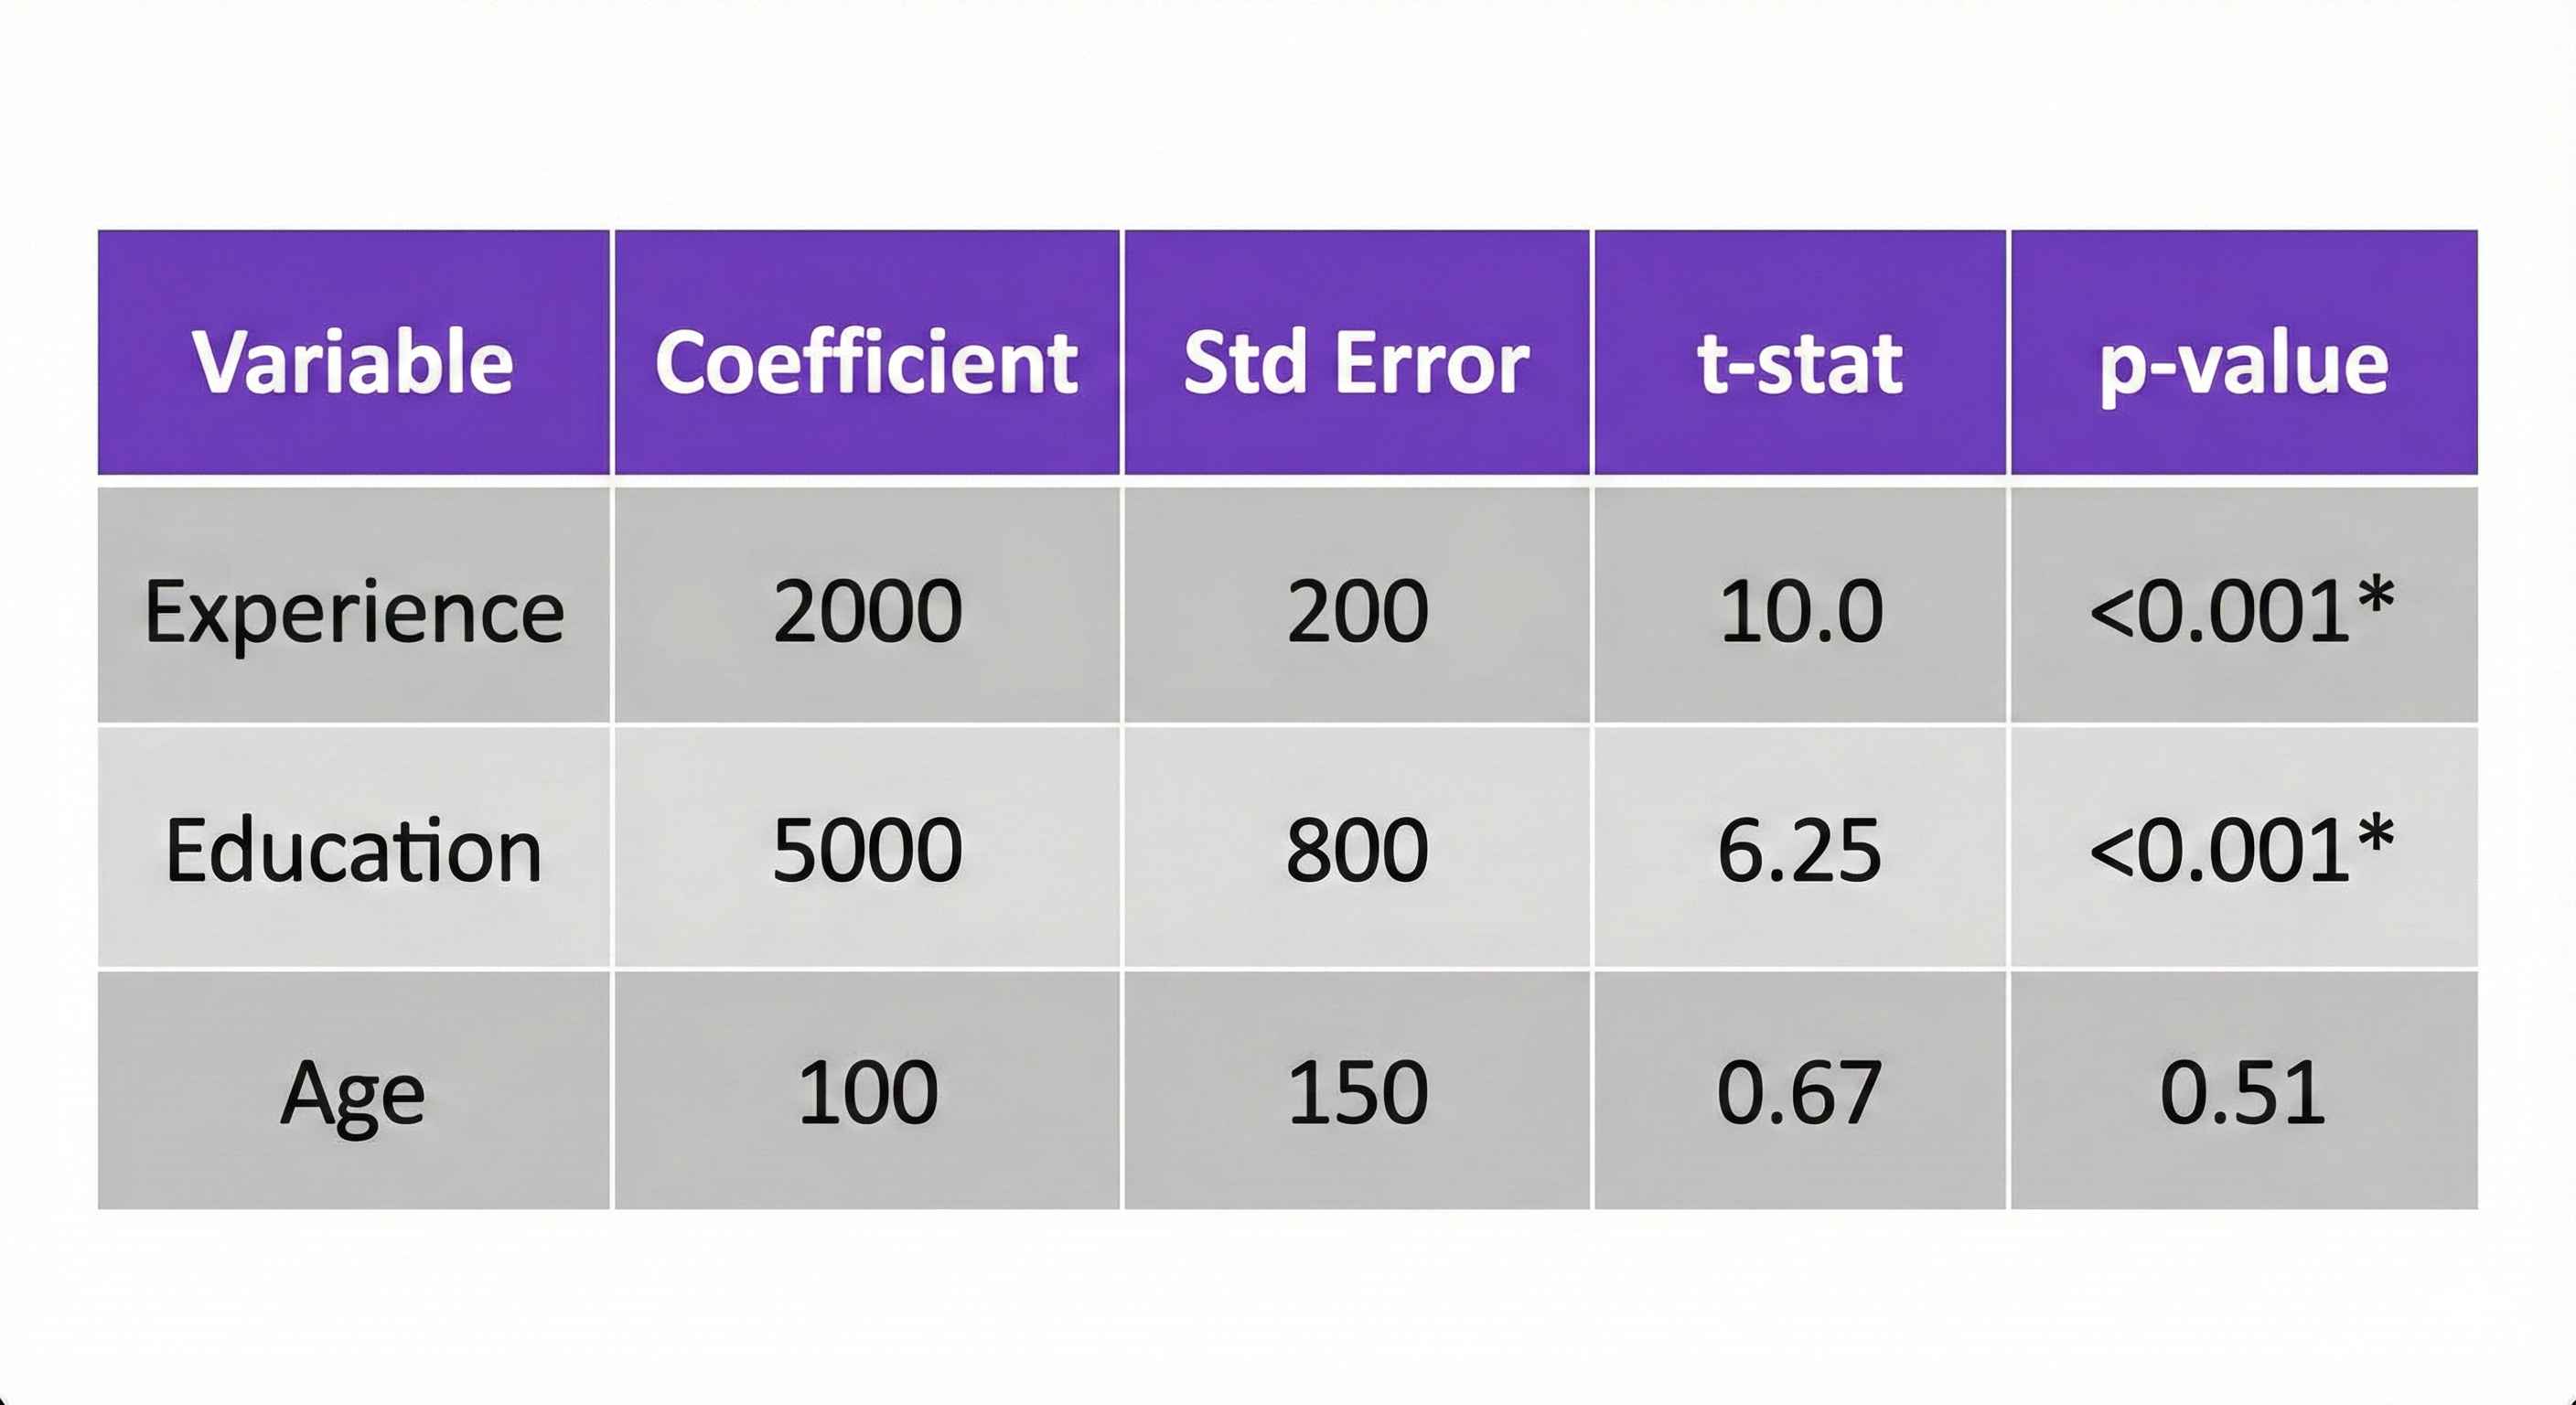
What you'll see:
Coefficient: The effect size P-value: Is it significant? R²: How good is the model?
Example: Experience: Coef = 2000, p < 0.001 → Each year adds $2000 to salary, and it's significant!
Understanding P-Values (Simple!)
p < 0.05: Result is significant ✓ p > 0.05: Not significant ✗
What this means:
- p = 0.001: Very strong evidence
- p = 0.03: Moderate evidence
- p = 0.10: Weak evidence
Don't overthink it! Under 0.05 = significant, over 0.05 = not significant
Making Predictions
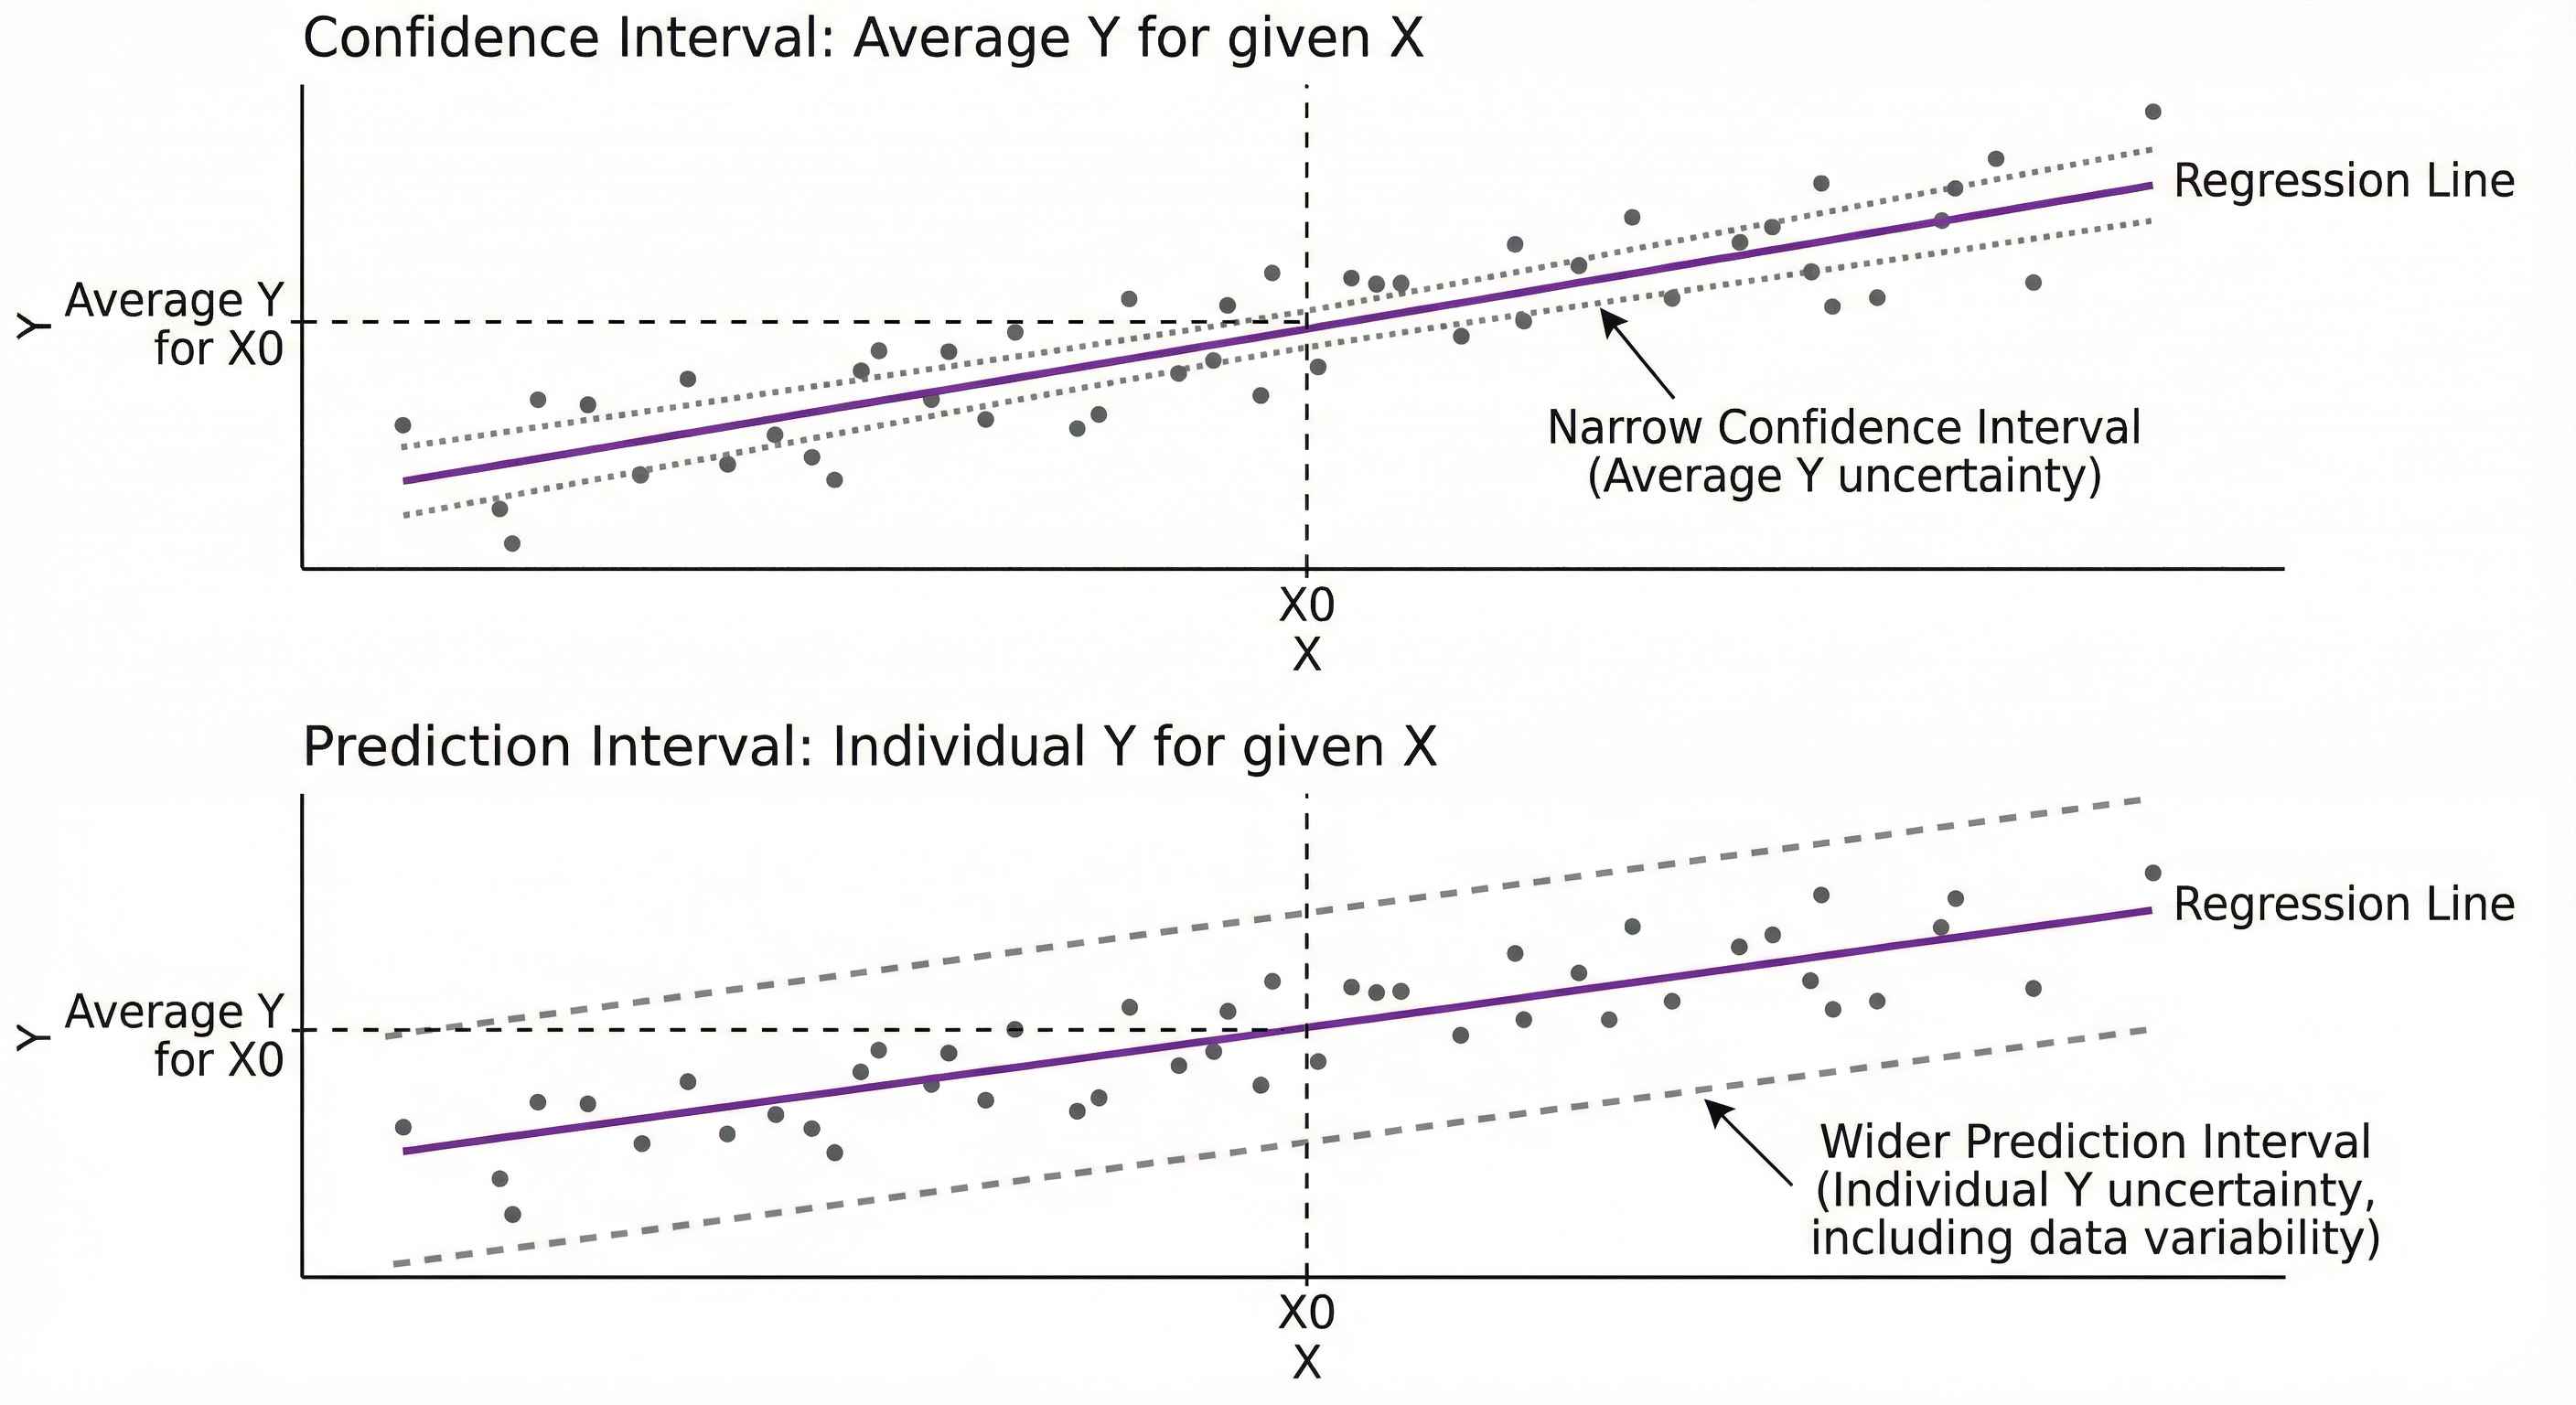
Example: Predicting salary for 5 years experience
Your prediction: $50,000
But give a range! "Between $40,000 - $60,000"
Why? Predictions aren't perfect - always show the range!
Practical vs Statistical Significance
Just because it's significant doesn't mean it matters!
Example: Ad campaign increases clicks by 0.01%
- p < 0.001 (significant!)
- But 0.01% increase? Not worth the cost!
Always ask: Is this big enough to care about?
Reporting Results (Easy Version)
Bad: "β = 2000, t = 10, p < 0.001"
Good: "Each year of experience adds $2,000 to salary (significant, p < 0.001)"
Even better: "Experience matters! Each year adds about $2,000 to salary. Our model explains 78% of salary differences."
Common Beginner Mistakes
Mistake 1: Saying "causes" ❌ "Experience causes higher salary" ✓ "Experience is associated with higher salary"
Mistake 2: Ignoring p-values Check if results are significant before believing them!
Mistake 3: Forgetting ranges Always give prediction ranges, not just a single number
Mistake 4: Missing "holding others constant" "Each year adds $2000 (holding education and location constant)"
5. Extrapolating Don't predict outside data range
Practice Exercise
Regression output: DV: House Price ($1000s)
Variable | Coef | SE | t | p-value Sqft | 0.15 | 0.02 | 7.5 | <0.001 Bedrooms | 12 | 8 | 1.5 | 0.14 Age | -2 | 0.5 | -4.0 | <0.001 Urban | 25 | 10 | 2.5 | 0.01
R² = 0.82, Adj R² = 0.80, F = 89.2, p < 0.001
Questions:
- Which variables are significant?
- Interpret the Sqft coefficient
- Should you remove Bedrooms?
- Write a one-paragraph summary
Next Steps
Learn about A/B Test Design!
Tip: Clear communication is as important as correct analysis!