Module 6
6 min read
Tables and Matrices
Master table and matrix visuals for detailed data display
What You'll Learn
- Difference between tables and matrices
- When to use each
- Conditional formatting basics
Table vs Matrix
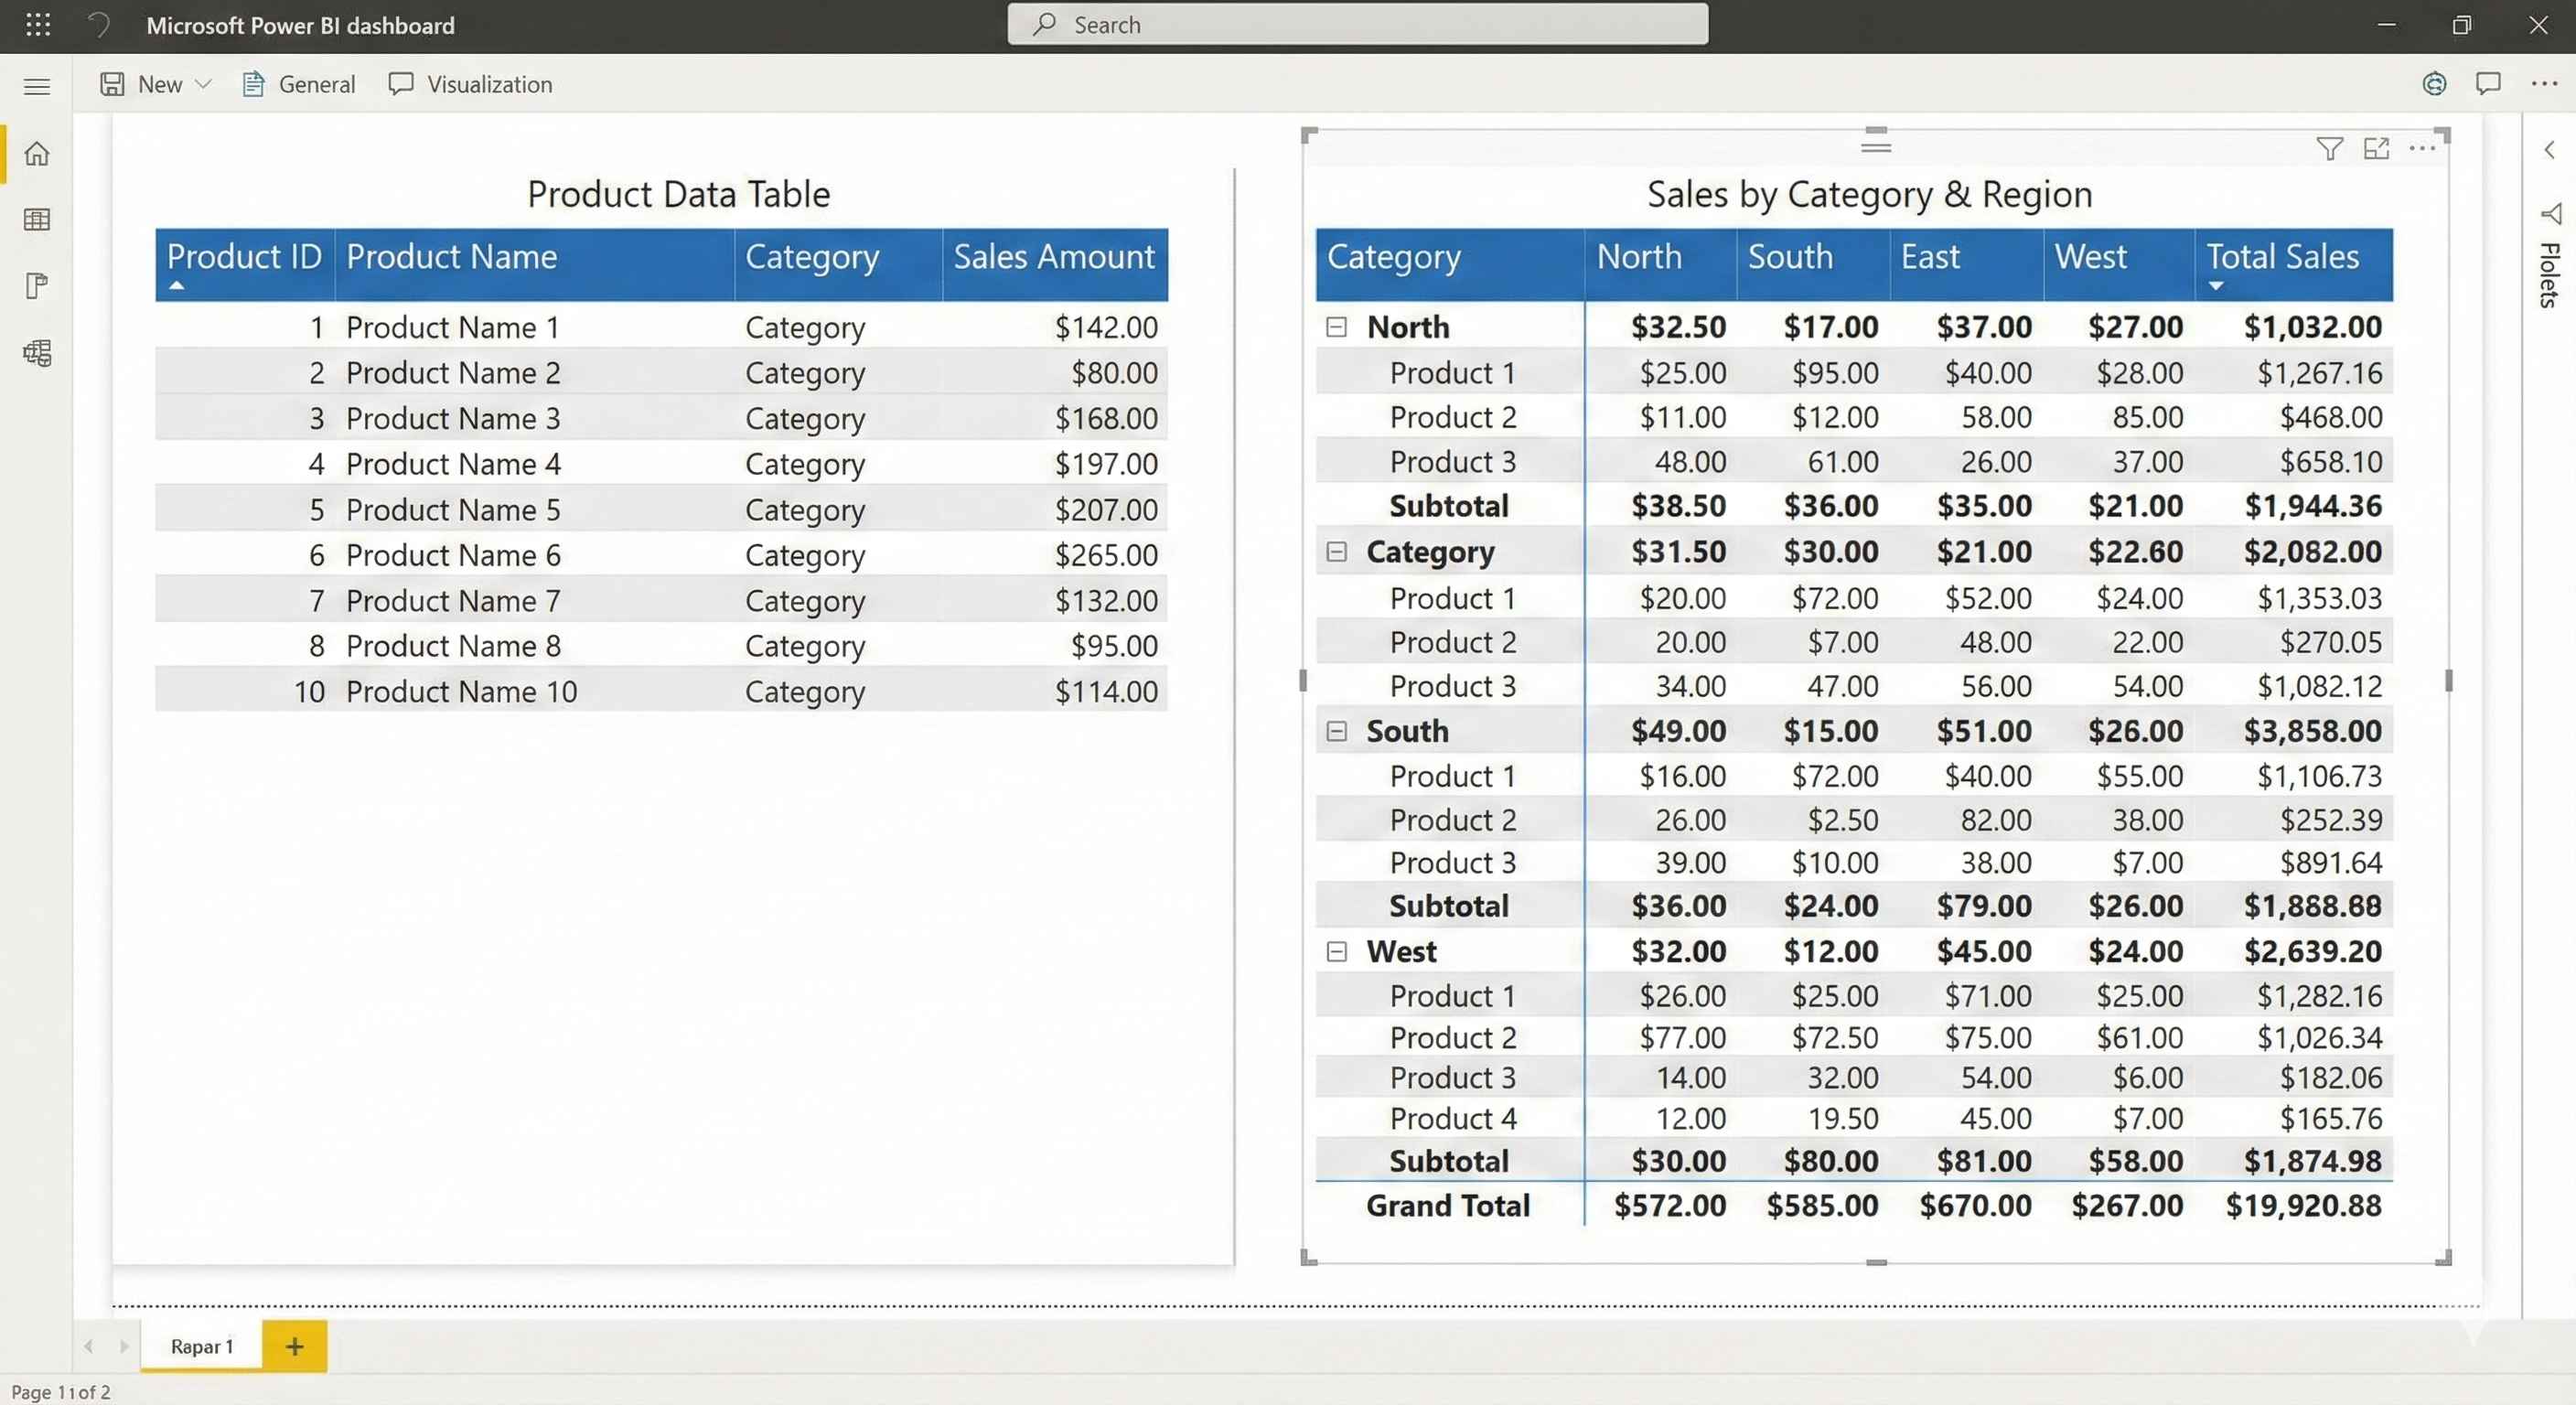
| Feature | Table | Matrix |
|---|---|---|
| Structure | Simple rows & columns | Grouped with subtotals |
| Like | Excel sheet | Pivot table |
| Grouping | No | Yes |
| Drill down | No | Yes |
| Use for | Raw data, lists | Summary reports |
When to Use Table
- Transaction lists
- Customer details
- Order records
- Export to Excel
- Showing exact values
How to create:
- Click Table icon
- Drag fields to Columns well
- Reorder by dragging
When to Use Matrix
- Summary reports
- Sales by Category by Year
- Hierarchical data
- When you need subtotals
How to create:
- Click Matrix icon
- Drag fields to Rows (for grouping)
- Drag fields to Columns (optional)
- Drag measures to Values
Conditional Formatting
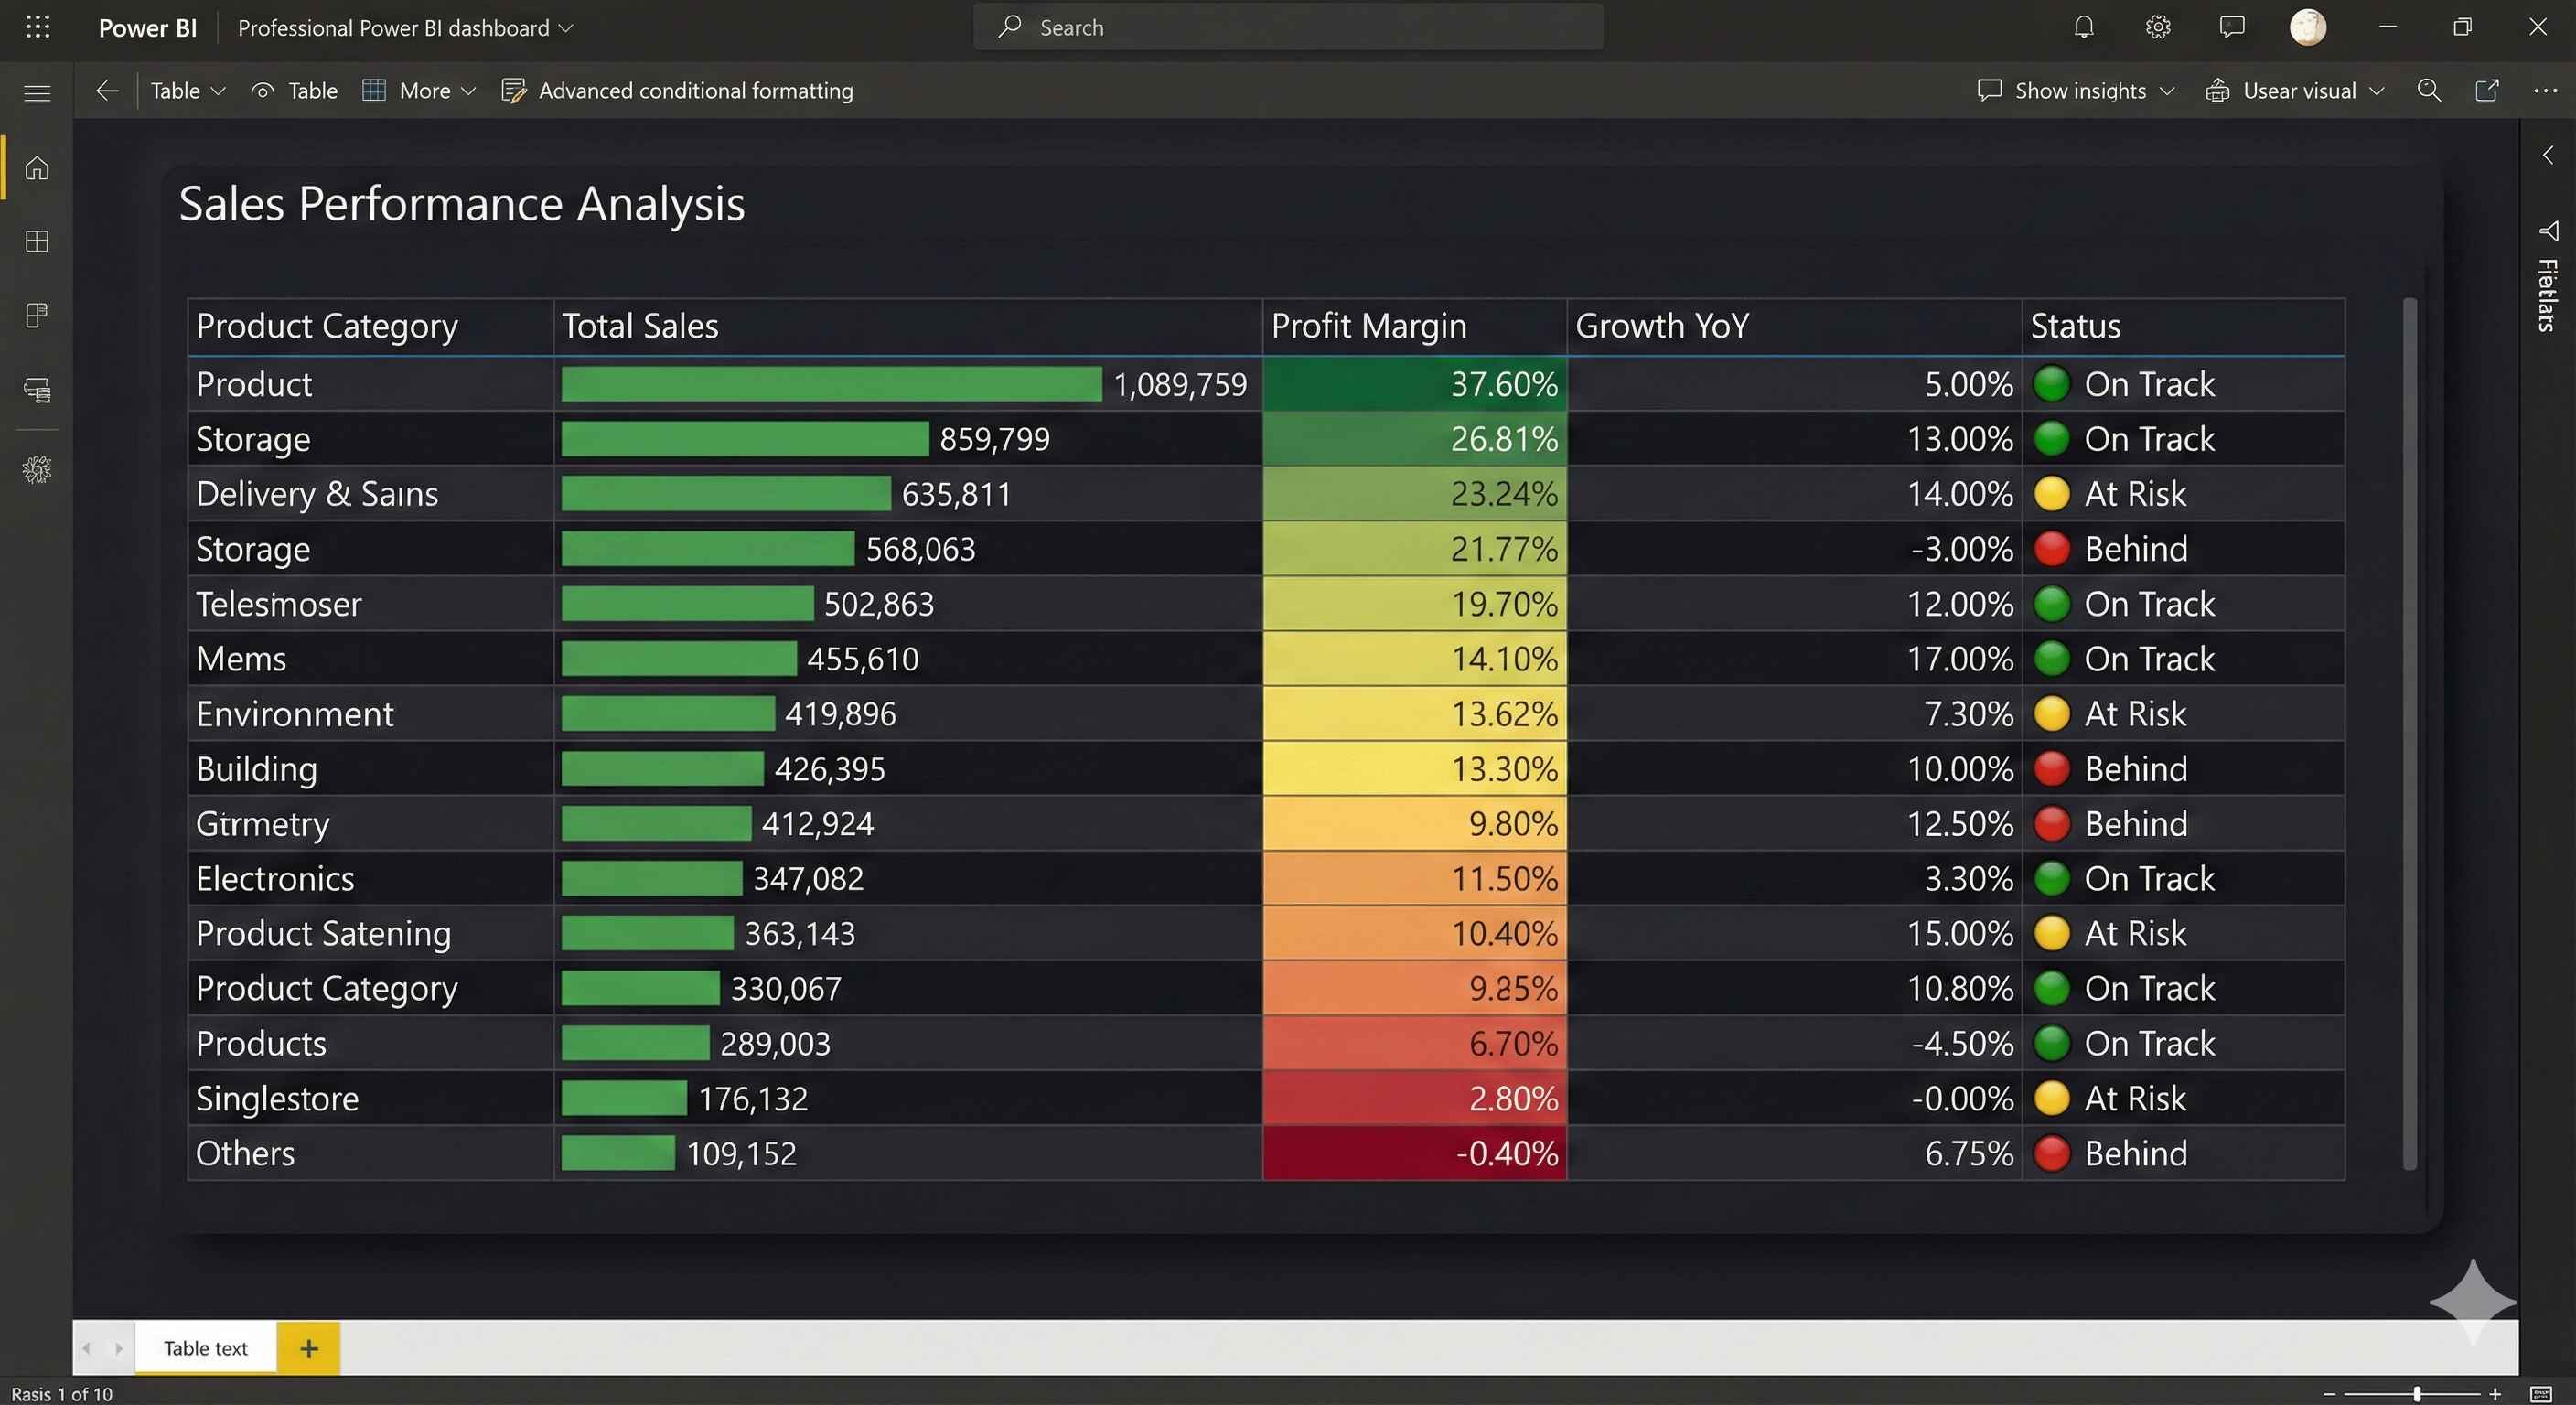
Make your data visual with colors and icons:
| Type | Use For |
|---|---|
| Data Bars | Show relative values |
| Background Color | Highlight high/low |
| Font Color | Color text by value |
| Icons | Traffic lights, arrows |
How to apply: Format > Values > Select formatting type > On
Quick Tips
Tables:
- Limit to 20-30 rows
- Sort meaningfully
- Add data bars for numbers
Matrices:
- Start collapsed
- Use stepped layout
- Enable subtotals
Both:
- Format numbers ($, %)
- Use consistent colors
- Export to Excel works great!
Try This
- Create a Table with Product, Category, Price
- Add data bars to Price column
- Create a Matrix with Category in Rows, Year in Columns, Sales in Values
- Expand/collapse to see drill down
Tip: Table = raw data. Matrix = pivot table. Choose based on your need!