Financial Model - Phase 4: Dashboard & Polish
Create visual dashboard, charts, and final professional touches
Financial Model - Phase 4: Dashboard & Polish
Final phase! Let's create a beautiful dashboard.
Phase Progress
✅ Phase 1: Setup & Inputs
✅ Phase 2: Calculations Engine
✅ Phase 3: Analysis & Metrics
🔵 Phase 4: Dashboard & Polish (You are here - final stretch!)
Step 9: Build the Dashboard (Visual Summary)
Now let's make it beautiful and easy to understand.
Instructions:
- Click the Dashboard tab
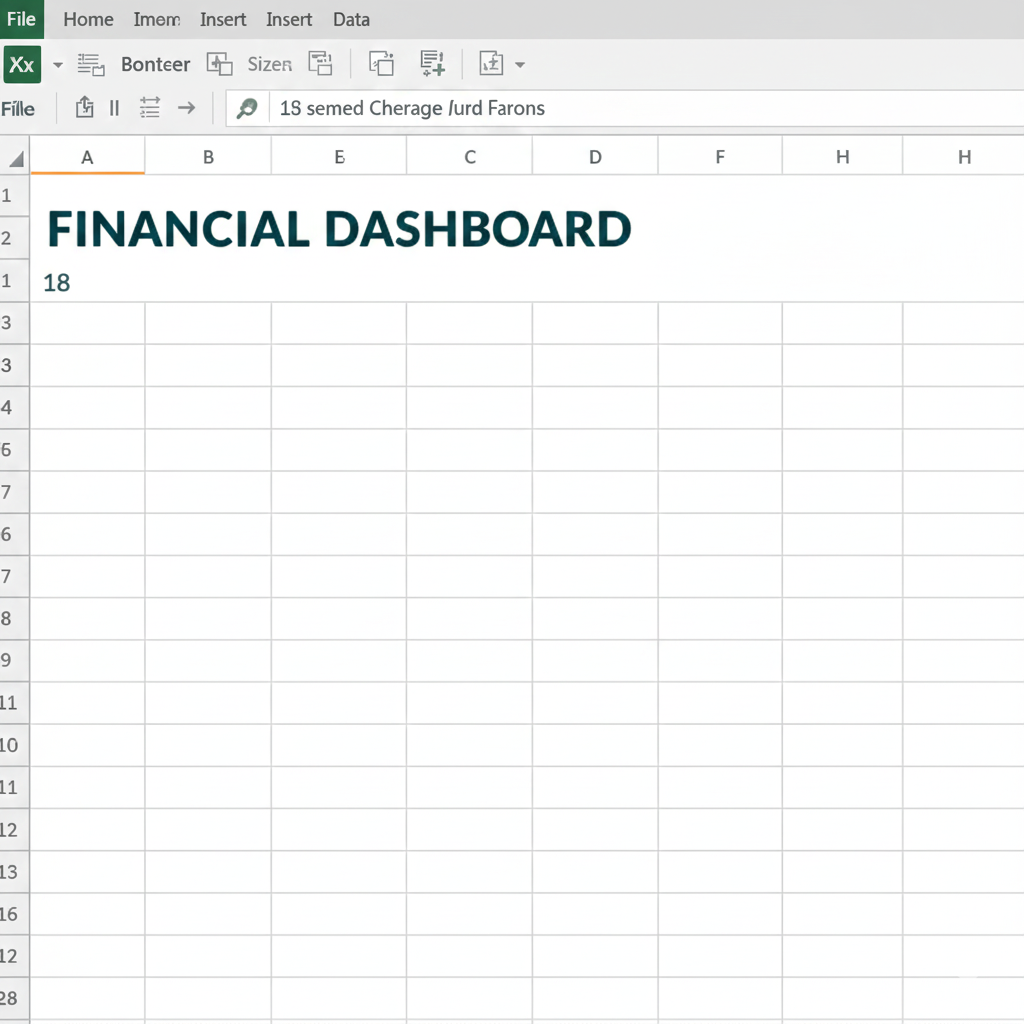
- Create a title:
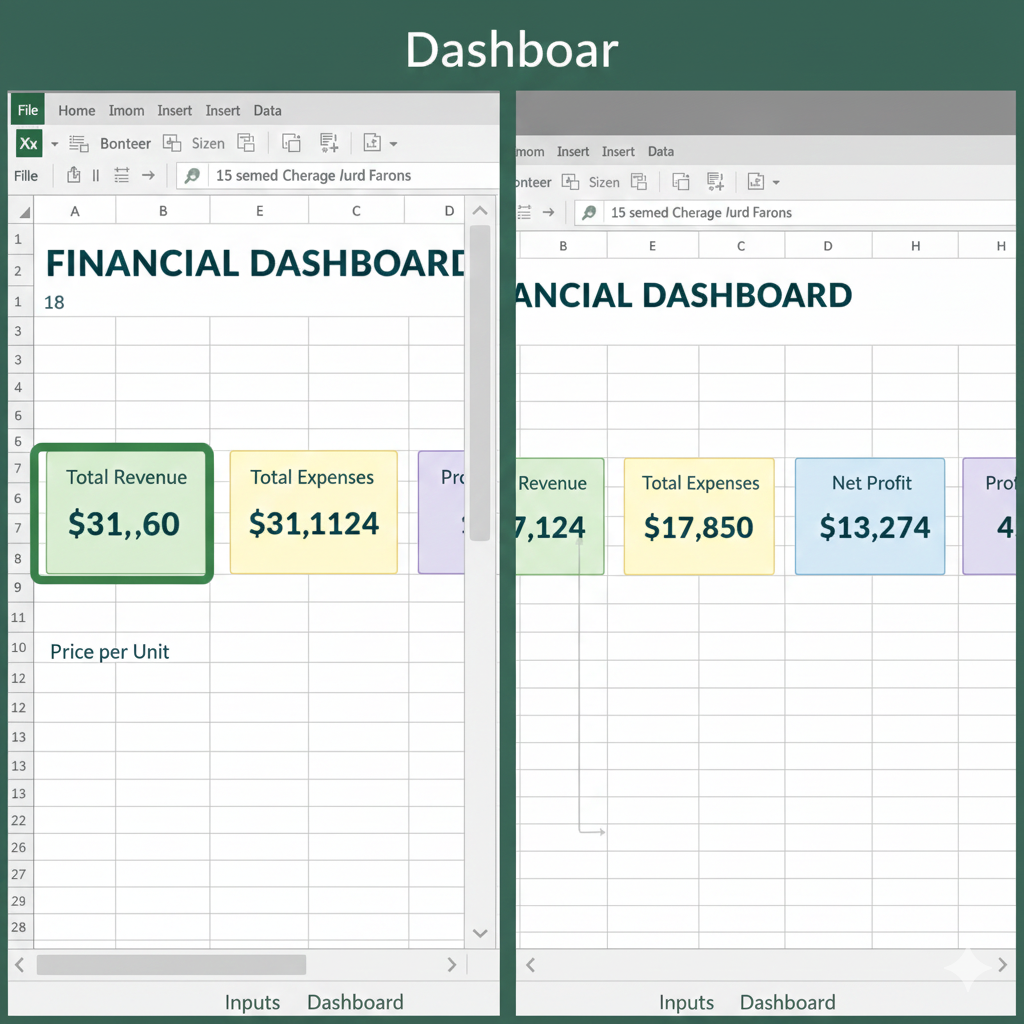
- Cell A1: "FINANCIAL DASHBOARD"
- Font size 18, Bold, Dark Blue
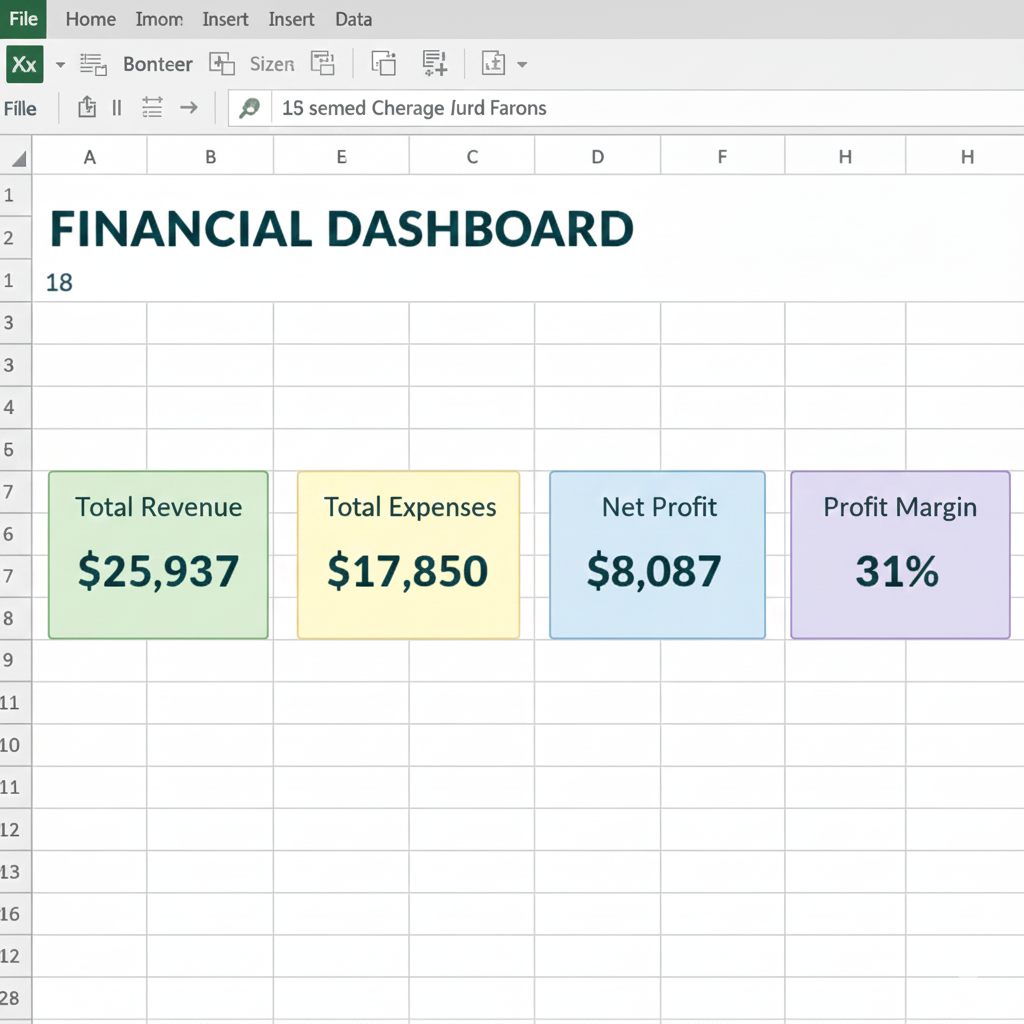
- Add KPI Cards (Key Performance Indicators):
Create boxes to show important numbers:
| Cell | Label | Formula Cell | Formula |
|---|---|---|---|
| B3 | Total Revenue | B4 | =Calculations!B19 |
| D3 | Total Expenses | D4 | =Calculations!B20 |
| F3 | Net Profit | F4 | =Calculations!B21 |
| H3 | Profit Margin | H4 | =Calculations!B22 |
- Format the KPI cards:
- Select B3:B4, add border, fill with light green
- Select D3:D4, add border, fill with light yellow
- Select F3:F4, add border, fill with light blue
- Select H3:H4, add border, fill with light purple
- Make the numbers (row 4) large font (size 14) and bold
-
Create a Revenue Chart:
- Select the Calculations sheet
- Highlight cells A1:M1 and A6:M6 (hold Ctrl while selecting)
- Insert tab → Line Chart → Line with Markers
- Move chart to Dashboard sheet
- Chart Title: "Monthly Revenue Growth"
-
Create a Profit Chart:
- Select A1:M1 and A16:M16 in Calculations sheet
- Insert → Column Chart
- Move to Dashboard sheet
- Title: "Monthly Profit/Loss"
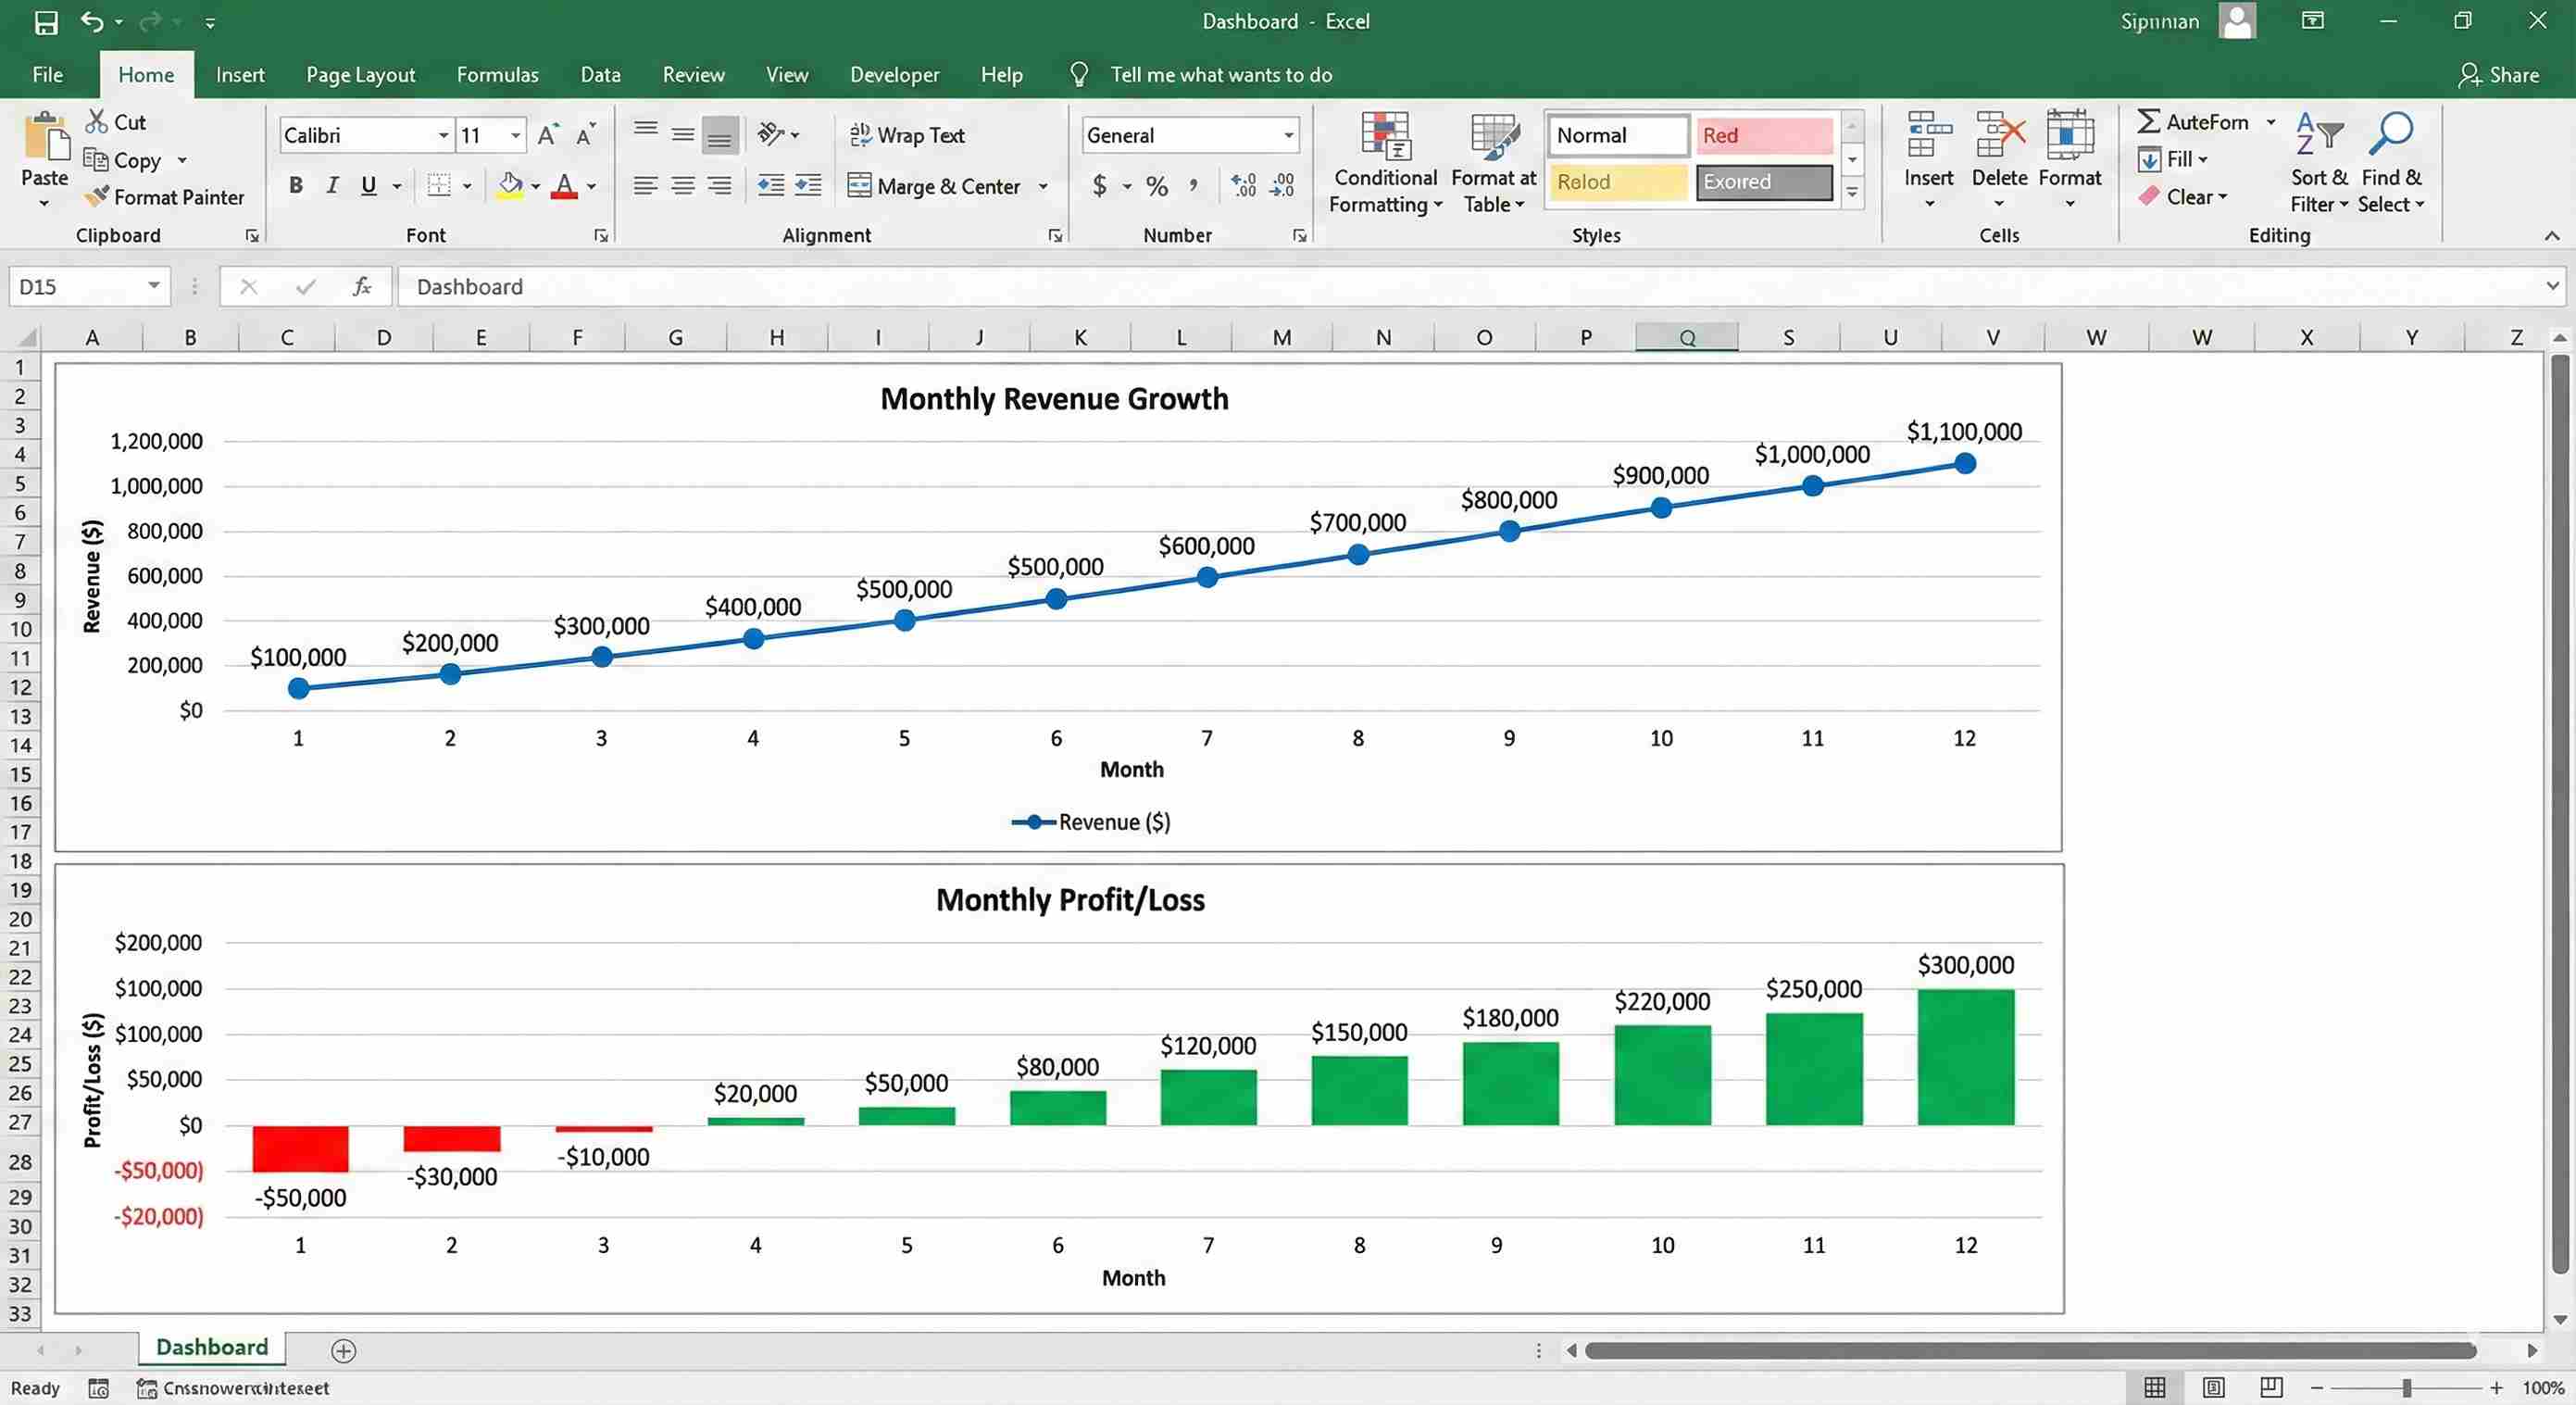
✓ Checkpoint: Your dashboard should have:
- 4 KPI cards at top showing key numbers
- Revenue growth line chart
- Profit/loss column chart
Step 10: Add Data Validation (Make it User-Friendly)
Let's make sure nobody enters wrong data.
Instructions:
-
Go back to Inputs sheet
-
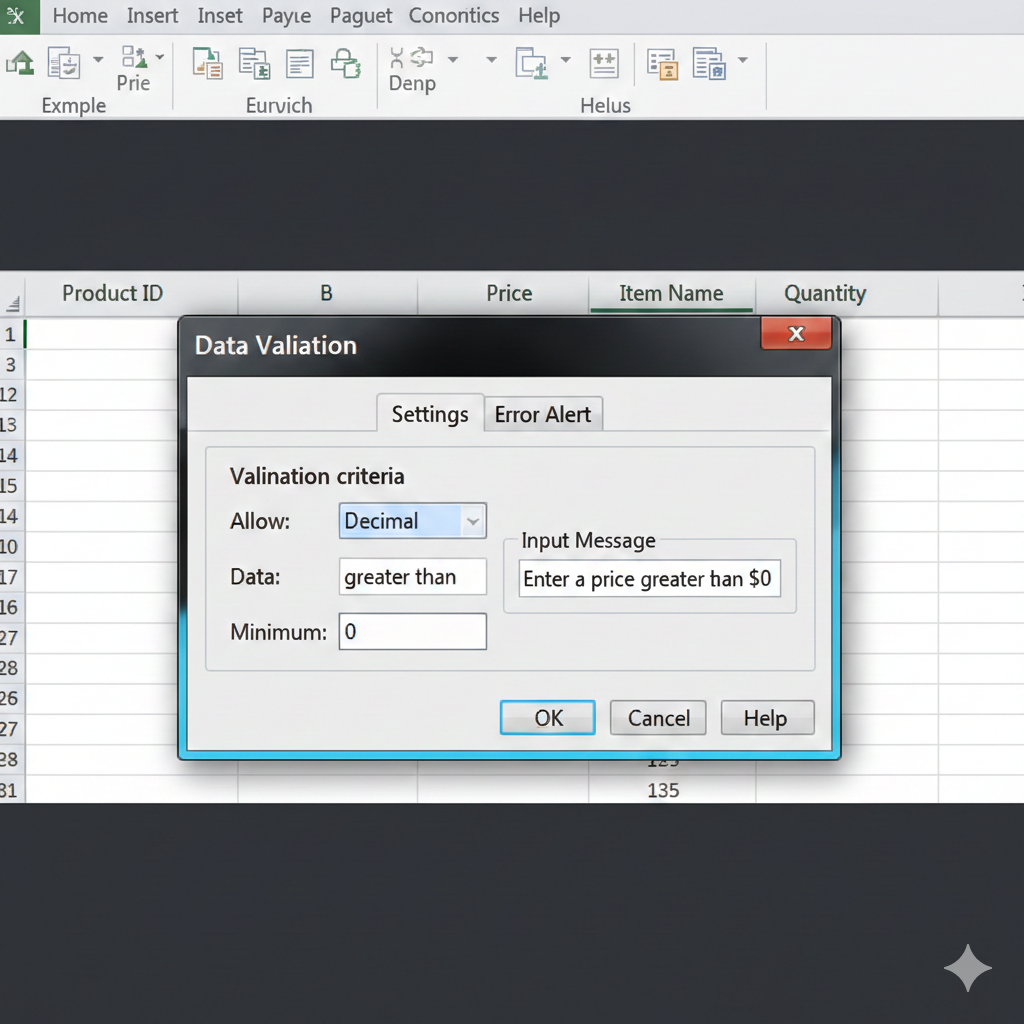
Protect price from negative numbers:
- Select cell B9 (Price per Unit)
- Data tab → Data Validation
- Allow: Decimal
- Data: greater than
- Minimum: 0
- Click OK
-
Add an input message:
- Select B9 again
- Data Validation → Input Message tab
- Title: "Enter Price"
- Message: "Enter a price greater than $0"
- Click OK
-
Repeat for other input cells:
- B10 (Units): Must be whole number > 0
- B11 (Growth): Must be between 0% and 50%
- B14-B18 (Costs): Must be >= 0
✓ Checkpoint: Try entering -10 in B9. Excel should reject it!
Step 11: Test Your Model (Change Scenarios)
Let's see the power of what you built!
Scenario 1: Higher Price
- Go to Inputs sheet
- Change B9 from $50 to $60
- Watch the Dashboard update!
- Net profit should jump significantly
Scenario 2: Faster Growth
- Change B11 from 10% to 15%
- Watch revenue accelerate
- Break-even happens earlier
Scenario 3: More Starting Sales
- Change B10 from 20 to 30 units
- Month 1 is now profitable!
This is the power of a financial model! Change one assumption, everything updates.
Step 12: Protect Your Work
Let's lock the formulas so nobody accidentally breaks them.
Instructions:
-
On Calculations sheet:
- Select all cells (Ctrl + A)
- Right-click → Format Cells
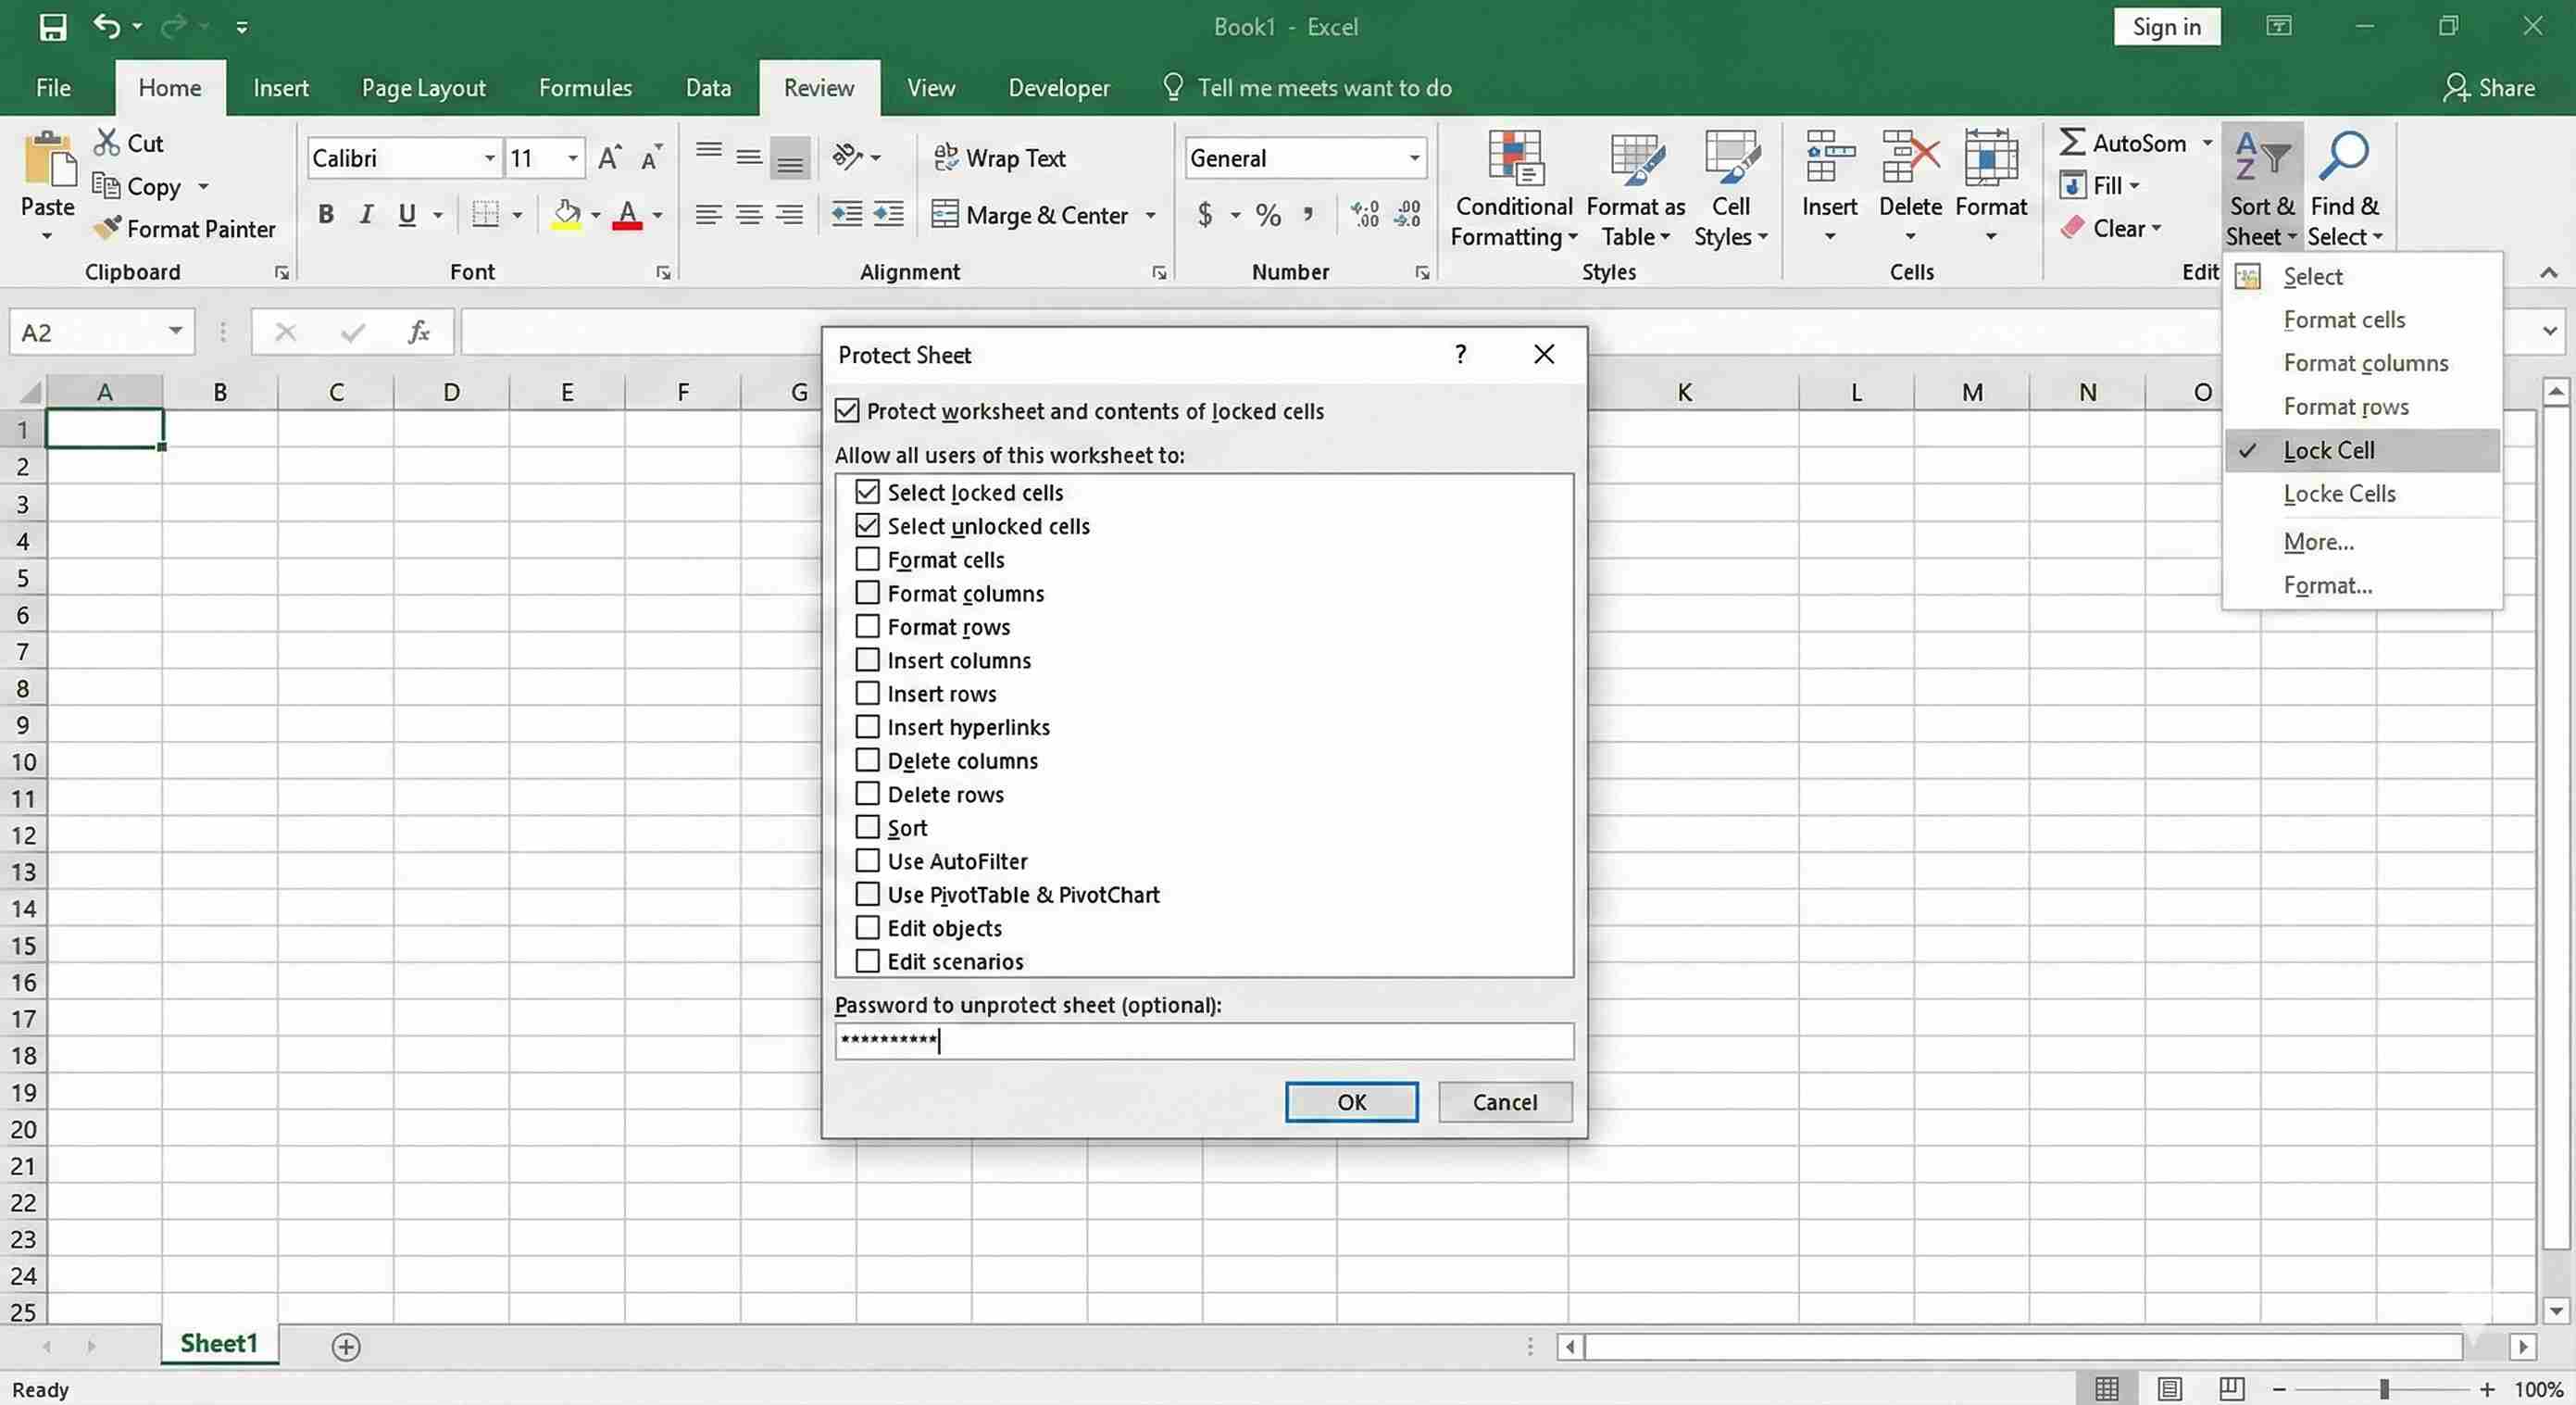
- Protection tab → Check "Locked"
- Click OK
-
Protect the sheet:
- Review tab → Protect Sheet
- Uncheck "Select locked cells" (optional)
- Set a password (optional)
- Click OK
-
Leave Inputs sheet unlocked so users can change assumptions
-
Protect Dashboard sheet (same steps as Calculations)
✓ Checkpoint: You can now change inputs, but cannot accidentally edit formulas.
Common Mistakes & Troubleshooting
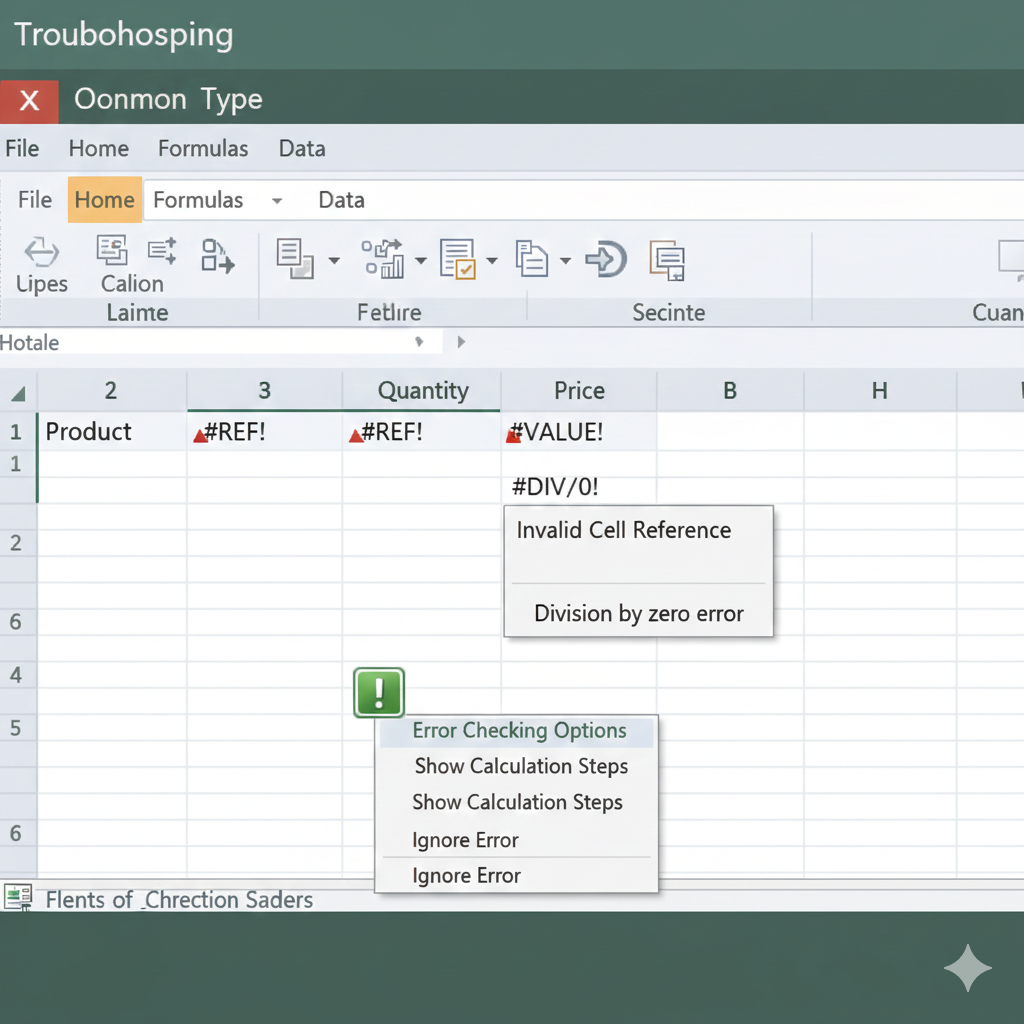
Problem 1: #REF! Error
What you see: #REF! in your formulas Why it happens: You deleted a cell that a formula references Fix: Press Ctrl + Z to undo. Be careful not to delete rows/columns.
Problem 2: Revenue Not Growing
What you see: All months show same units sold Why it happens: You copied B4 formula instead of C4 Fix:
- Delete C4:M4
- In C4 enter:
=B4*(1+Inputs!$B$11) - Copy C4 across to M4
Problem 3: #VALUE! Error
What you see: #VALUE! in calculations Why it happens: Text where numbers should be Fix: Check Inputs sheet - all numbers should be formatted as numbers, not text
Problem 4: Negative Profit Not Showing Red
What you see: Losses don't highlight Why it happens: Conditional formatting not applied Fix:
- Select B16:M16
- Home → Conditional Formatting → Highlight Cell Rules → Less Than 0
Problem 5: Dashboard Shows #N/A
What you see: Dashboard KPIs show errors Why it happens: Formula references wrong sheet/cell Fix: Click error cell, check formula bar, fix sheet reference
Enhancement Ideas
Want to take this further? Try these:
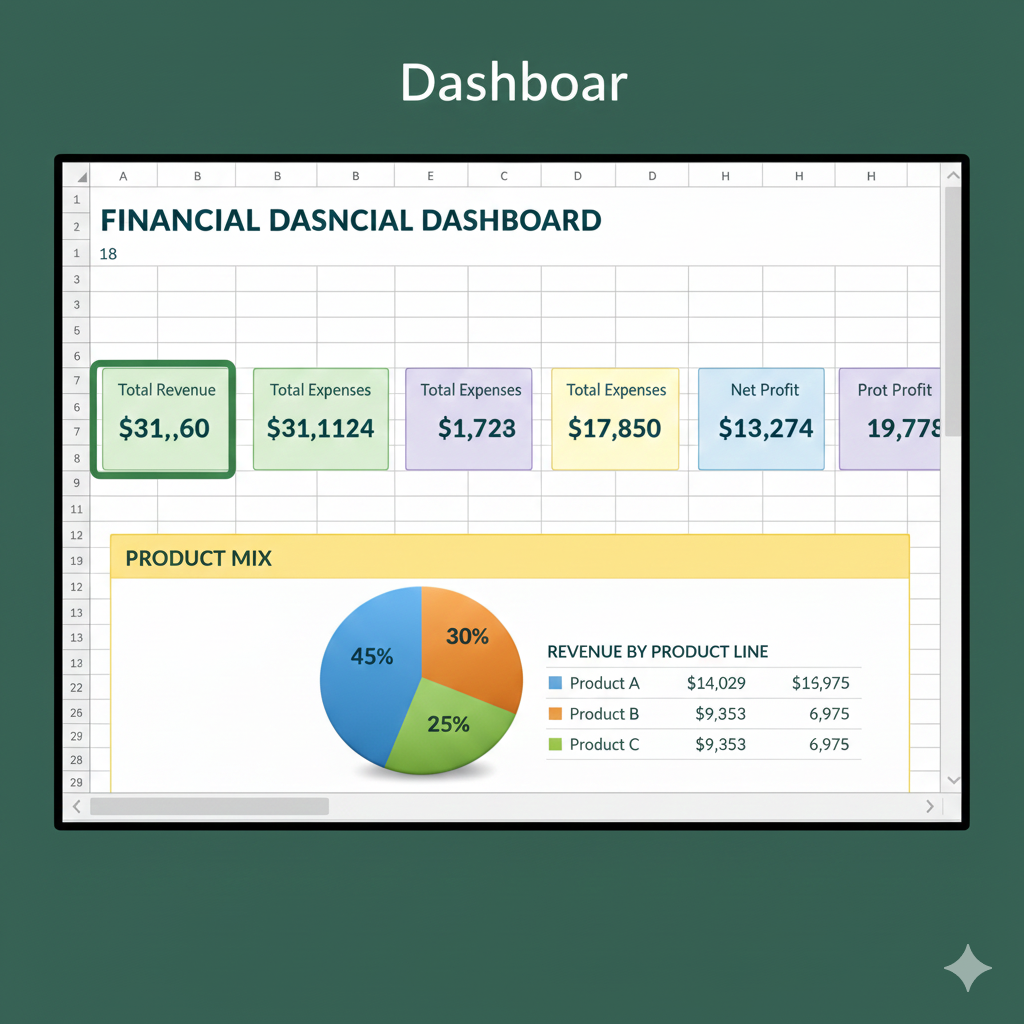
Enhancement 1: Add Multiple Products
- Expand Inputs to have 3 different products
- Calculate revenue for each
- Show product mix in a pie chart
Enhancement 2: Add Seasonality
- Create a seasonality factor (e.g., December = 150% of normal)
- Multiply monthly sales by seasonal factor
- More realistic for many businesses
Enhancement 3: Cash Flow Projection
- Add a new row "Cash Balance"
- Track when money comes in vs goes out
- Show when you might run out of cash
Enhancement 4: Scenario Comparison
- Create 3 versions: Conservative, Expected, Optimistic
- Use different growth rates for each
- Show all three on dashboard for comparison
Enhancement 5: Add Payroll
- Add "Number of Employees" to Inputs
- Add "Salary per Employee"
- Calculate monthly payroll expense
- Show when you can afford to hire
Quick Reference Card
Formulas Used in This Project
| Formula | What It Does | Example |
|---|---|---|
| =Sheet!Cell | Reference another sheet | =Inputs!B10 |
| =$B$1 | Absolute reference (locked) | =Inputs!$B$9 |
| =A1*B1 | Multiply two cells | =B4*B5 |
| =SUM(A1:A12) | Add a range | =SUM(B9:B13) |
| =A1-B1 | Subtract | =B6-B14 |
| =A1/B1 | Divide | =B21/B19 |
| =A1*(1+0.10) | Apply growth rate | =B4*(1+Inputs!$B$11) |
| =B1+C1 | Cumulative total | =B25+C16 |
Keyboard Shortcuts Used
| Shortcut | Action |
|---|---|
| Ctrl + S | Save workbook |
| Ctrl + B | Bold text |
| Ctrl + Shift + $ | Currency format |
| Ctrl + Shift + % | Percentage format |
| F4 | Toggle absolute reference ($) |
| Ctrl + C / Ctrl + V | Copy and paste |
| Ctrl + Z | Undo |
| Ctrl + A | Select all |
Key Takeaways
🎯 What you accomplished:
- Built a 12-month financial projection model
- Created formulas that reference multiple sheets
- Used absolute and relative references correctly
- Applied conditional formatting for visual insights
- Built an interactive dashboard with charts
- Protected your work from accidental changes
💪 Skills you can now use:
- Financial planning for any business
- "What-if" scenario analysis
- Professional workbook structure
- Cross-sheet formula references
- Data validation for user inputs
- Dashboard creation with KPIs
🚀 You are now capable of:
- Creating financial models for business plans
- Helping small businesses forecast finances
- Building budget trackers for personal use
- Understanding startup financial projections
- Presenting financial data visually
Confidence boost: You just built something that people pay consultants $500+ to create. Seriously! This is a valuable, marketable skill.
What's Next?
Congratulations on completing your first major Excel project! 🎉
Next Steps:
- Save this model as a template for future projects
- Practice by creating models for different business types (restaurant, consulting, retail)
- Move on to Project 2: Business Dashboard to learn advanced visualization
- Share your work with friends/family who might need financial planning help
Want More Practice?
- Try modeling your own side business idea
- Create a personal budget using the same techniques
- Model a lemonade stand, dog walking service, or tutoring business
- Challenge: Add more complexity (loans, investments, equipment purchases)
Related Topics to Explore:
- Pivot Tables for financial analysis
- Advanced charting techniques
- Scenario Manager tool
- Goal Seek for break-even analysis
- Solver for optimization problems
Your Financial Model Checklist
Before you mark this project complete, verify:
✅ Inputs sheet has all assumptions clearly labeled ✅ Calculations sheet shows 12 months of projections ✅ Revenue grows according to growth rate ✅ All formulas reference Inputs sheet (not hardcoded numbers) ✅ Net Profit row shows red for losses, normal for profits ✅ Dashboard shows 4 KPI cards with correct totals ✅ Charts display and update when you change inputs ✅ Break-even analysis shows cumulative profit ✅ Formulas are protected but inputs remain editable ✅ File is saved with a clear name
If all checked: Mark this lesson as complete and celebrate! You've built a real business tool! 🎊
You did it! This is a huge accomplishment. Take a moment to be proud of yourself. You now have a skill that will serve you for years to come.
Ready for the next challenge? Let's build a Business Dashboard! 📊