Module 2
4 min
Format Borders & Numbers
Add borders and format numbers like currency and percentages
Format Borders & Numbers
Make your data look clean with borders. Show numbers as money or percentages.
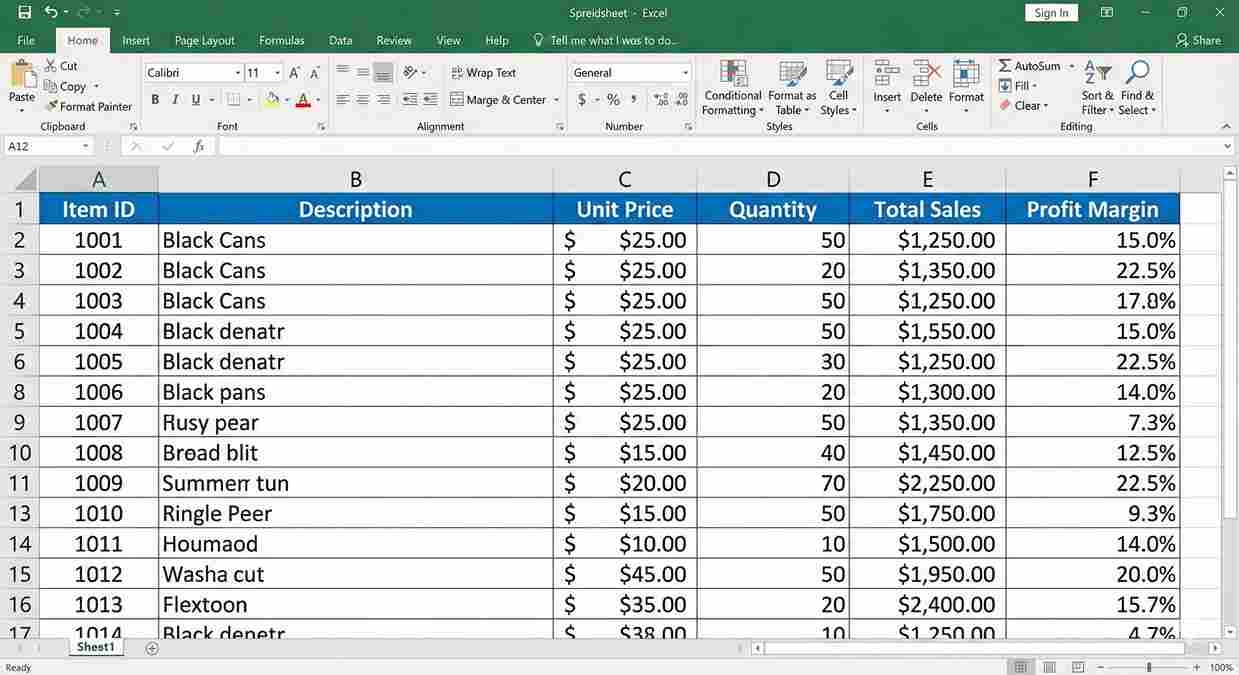
Part 1: Borders
Borders are lines around cells. They make tables easier to read.
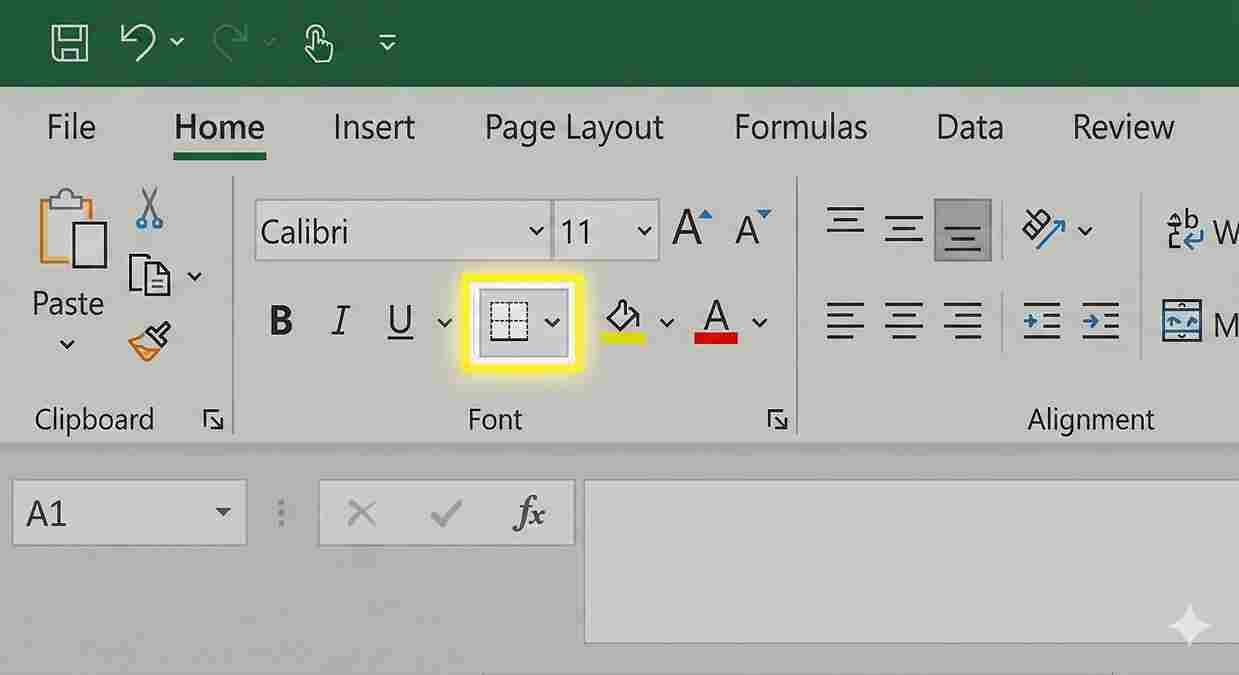
Add Borders
Step 1: Select your cells
Step 2: Go to Home tab
Step 3: Click the Borders button (small grid icon)
Step 4: Pick a border style
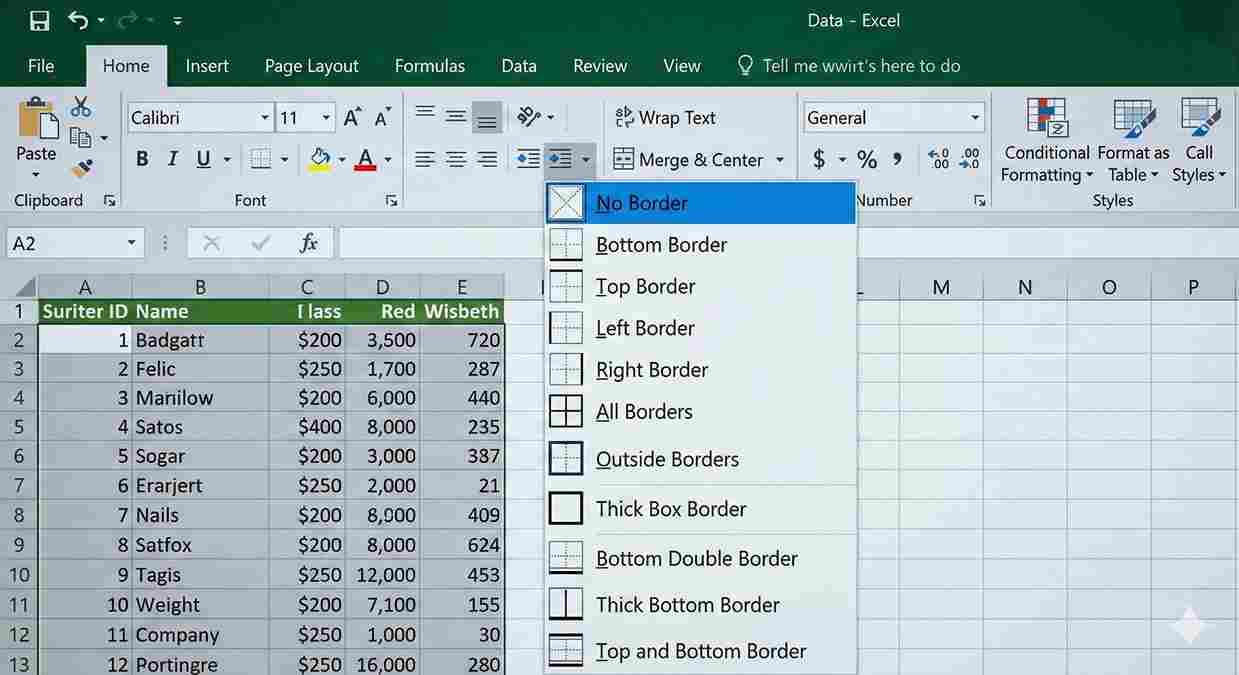
Border Options
| Option | What It Does |
|---|---|
| All Borders | Lines around every cell |
| Outside Borders | Lines only around the edge |
| Thick Box Border | Thick line around edge |
| Bottom Border | Line below cells only |
| No Border | Remove all borders |
5 rows
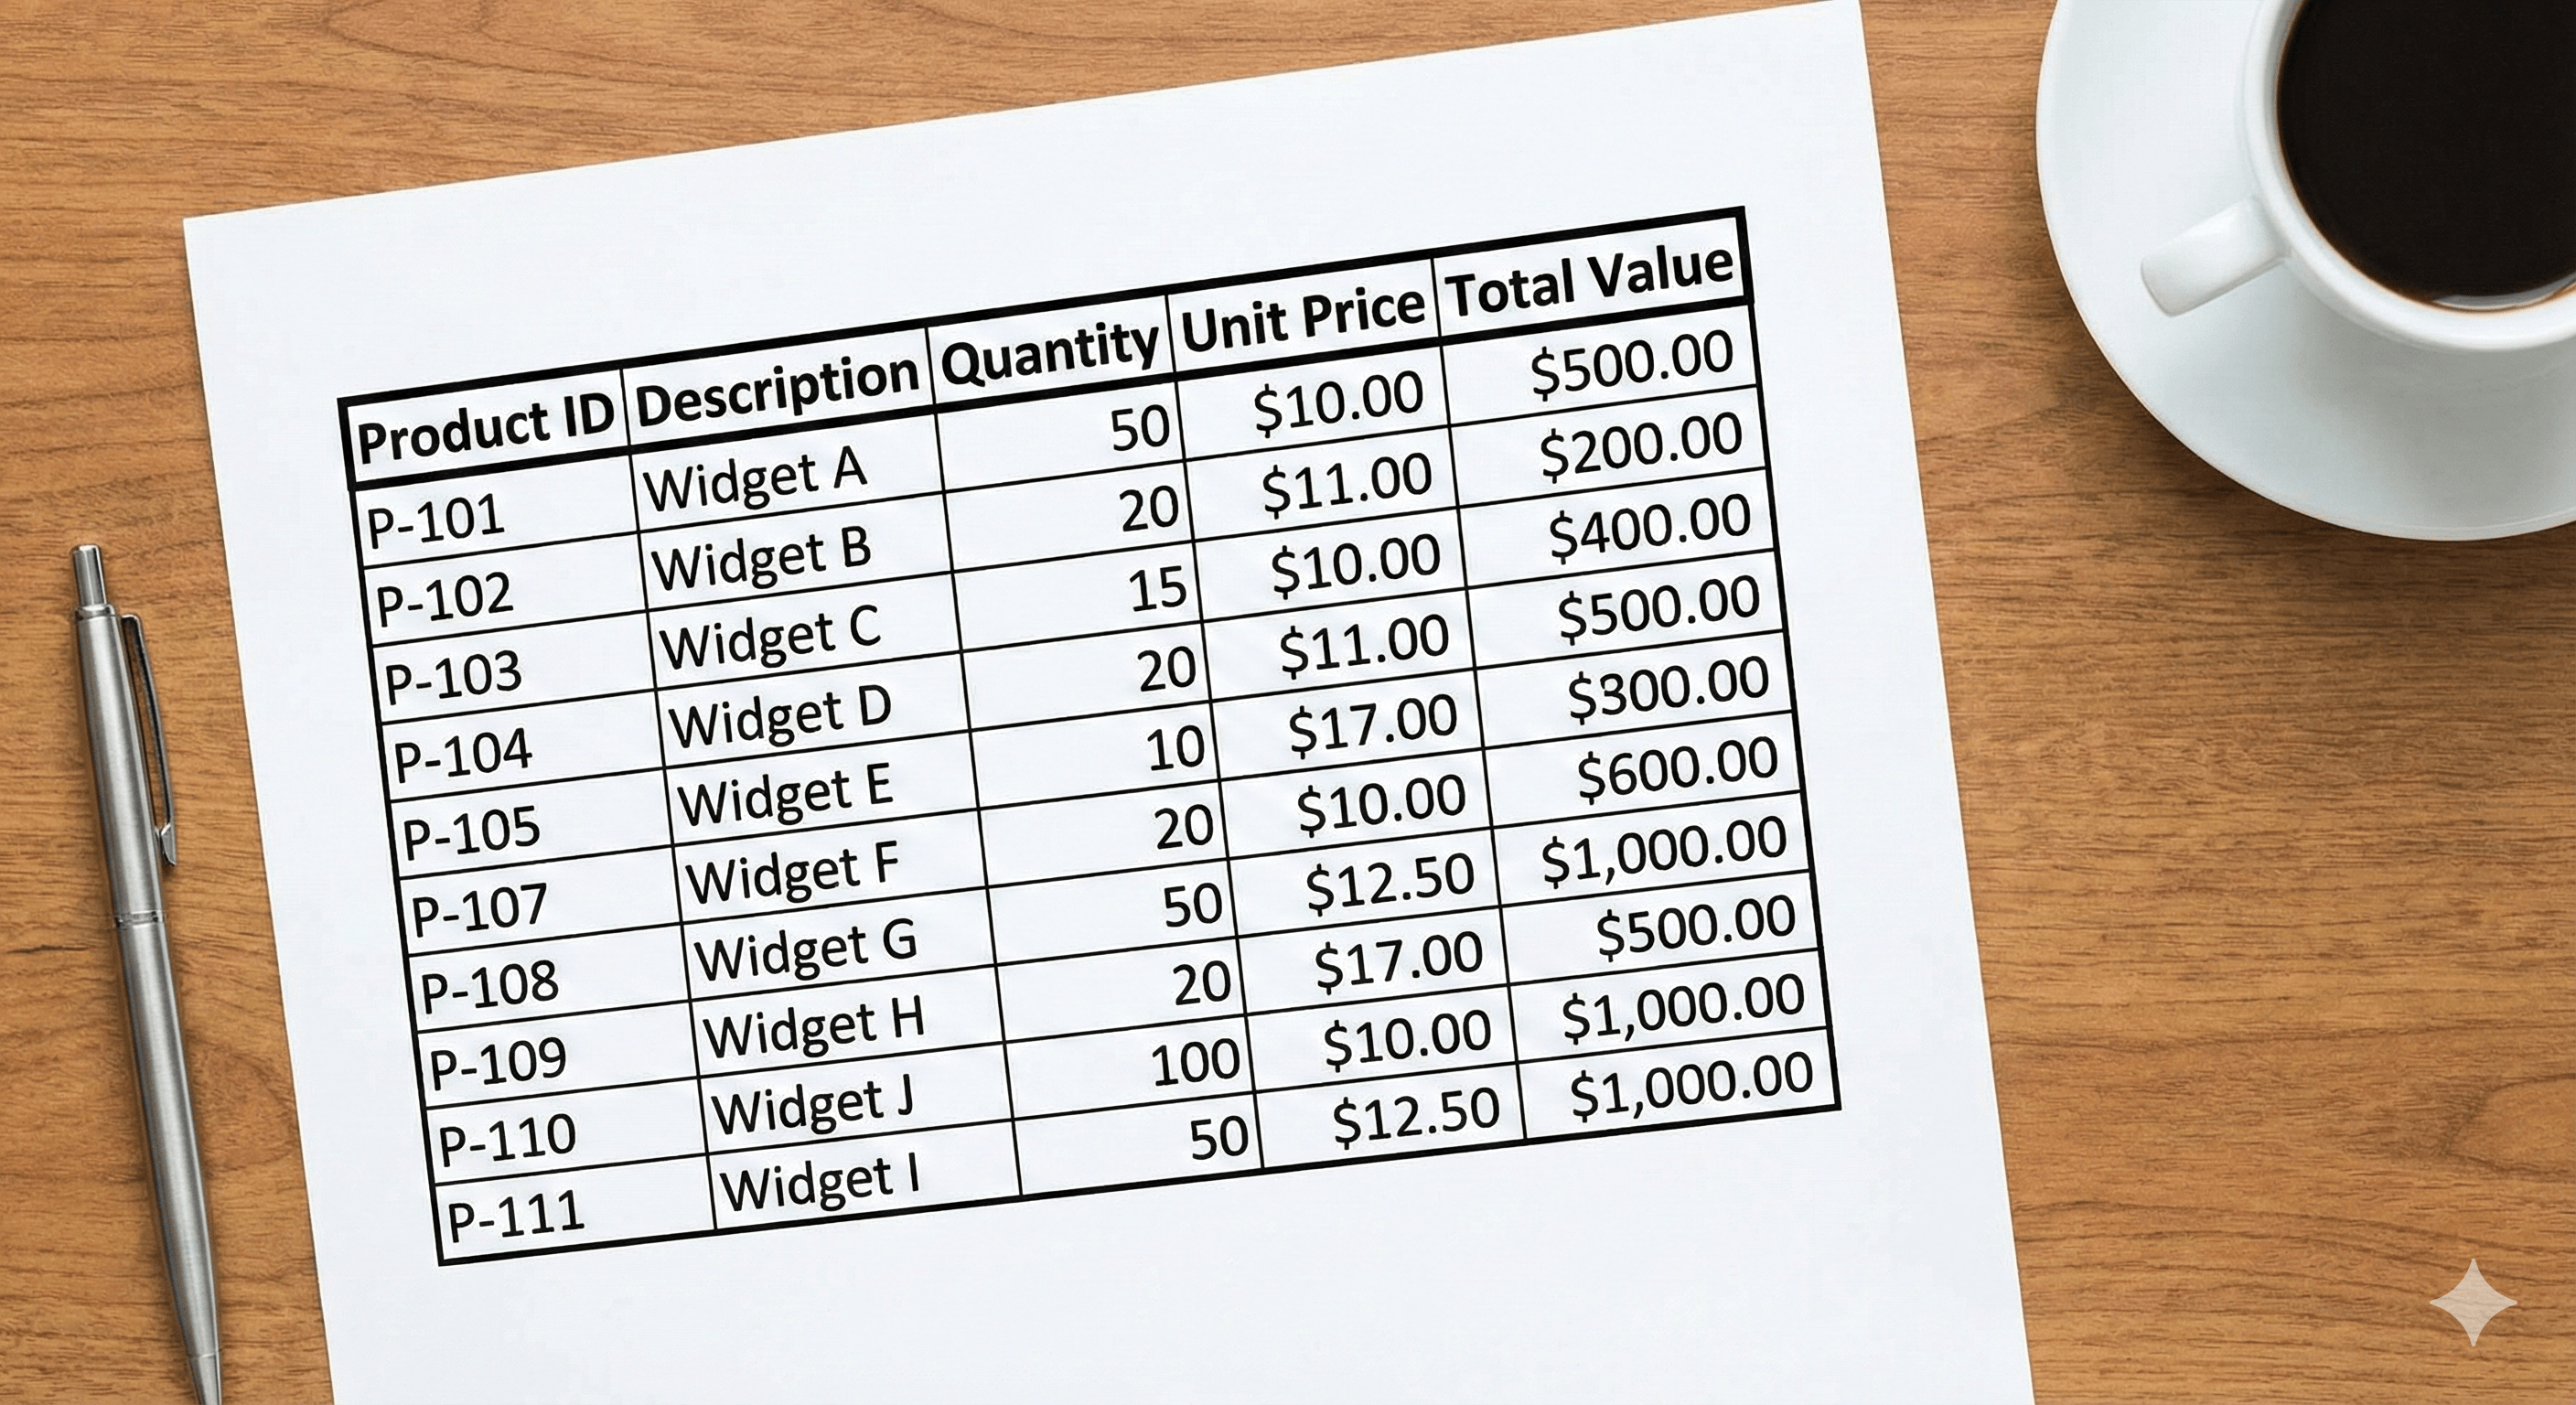
Best Practice
Use All Borders for data tables.
Use Thick Box Border around headers.
Part 2: Number Formats
Numbers can look different ways:
- 1000 → plain number
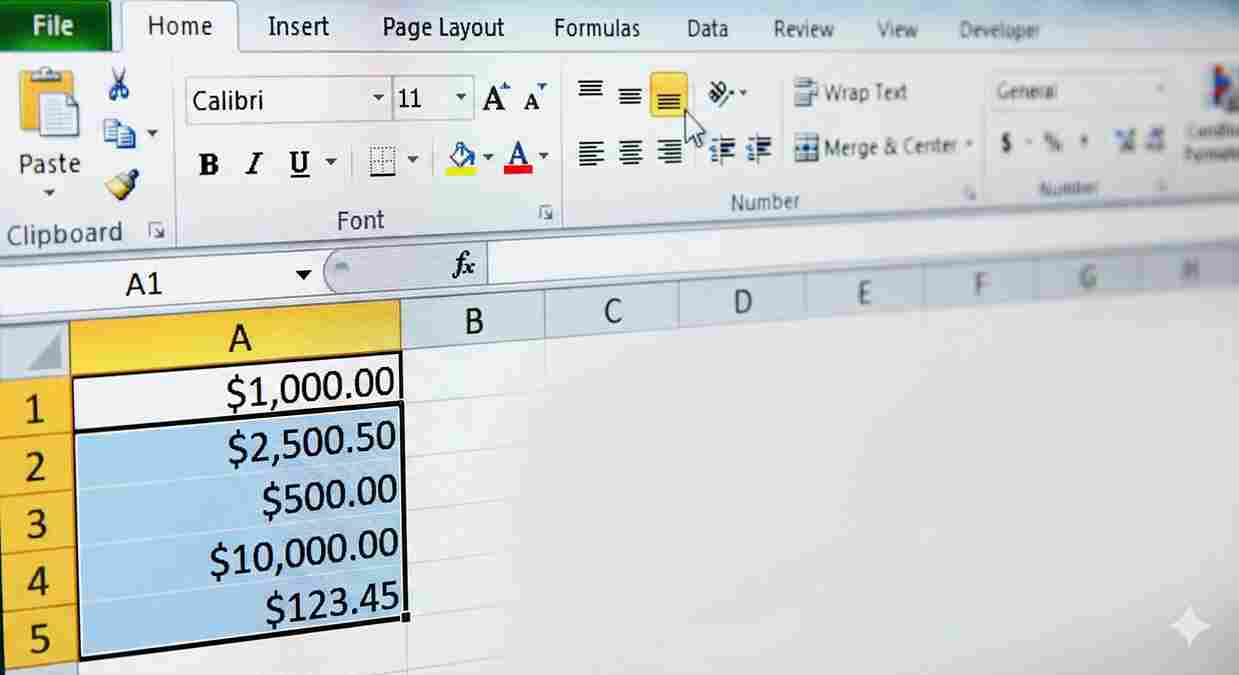
- $1,000 → currency
- 50% → percentage
- 12/25/2024 → date
Where to Find It
Home tab → Number group
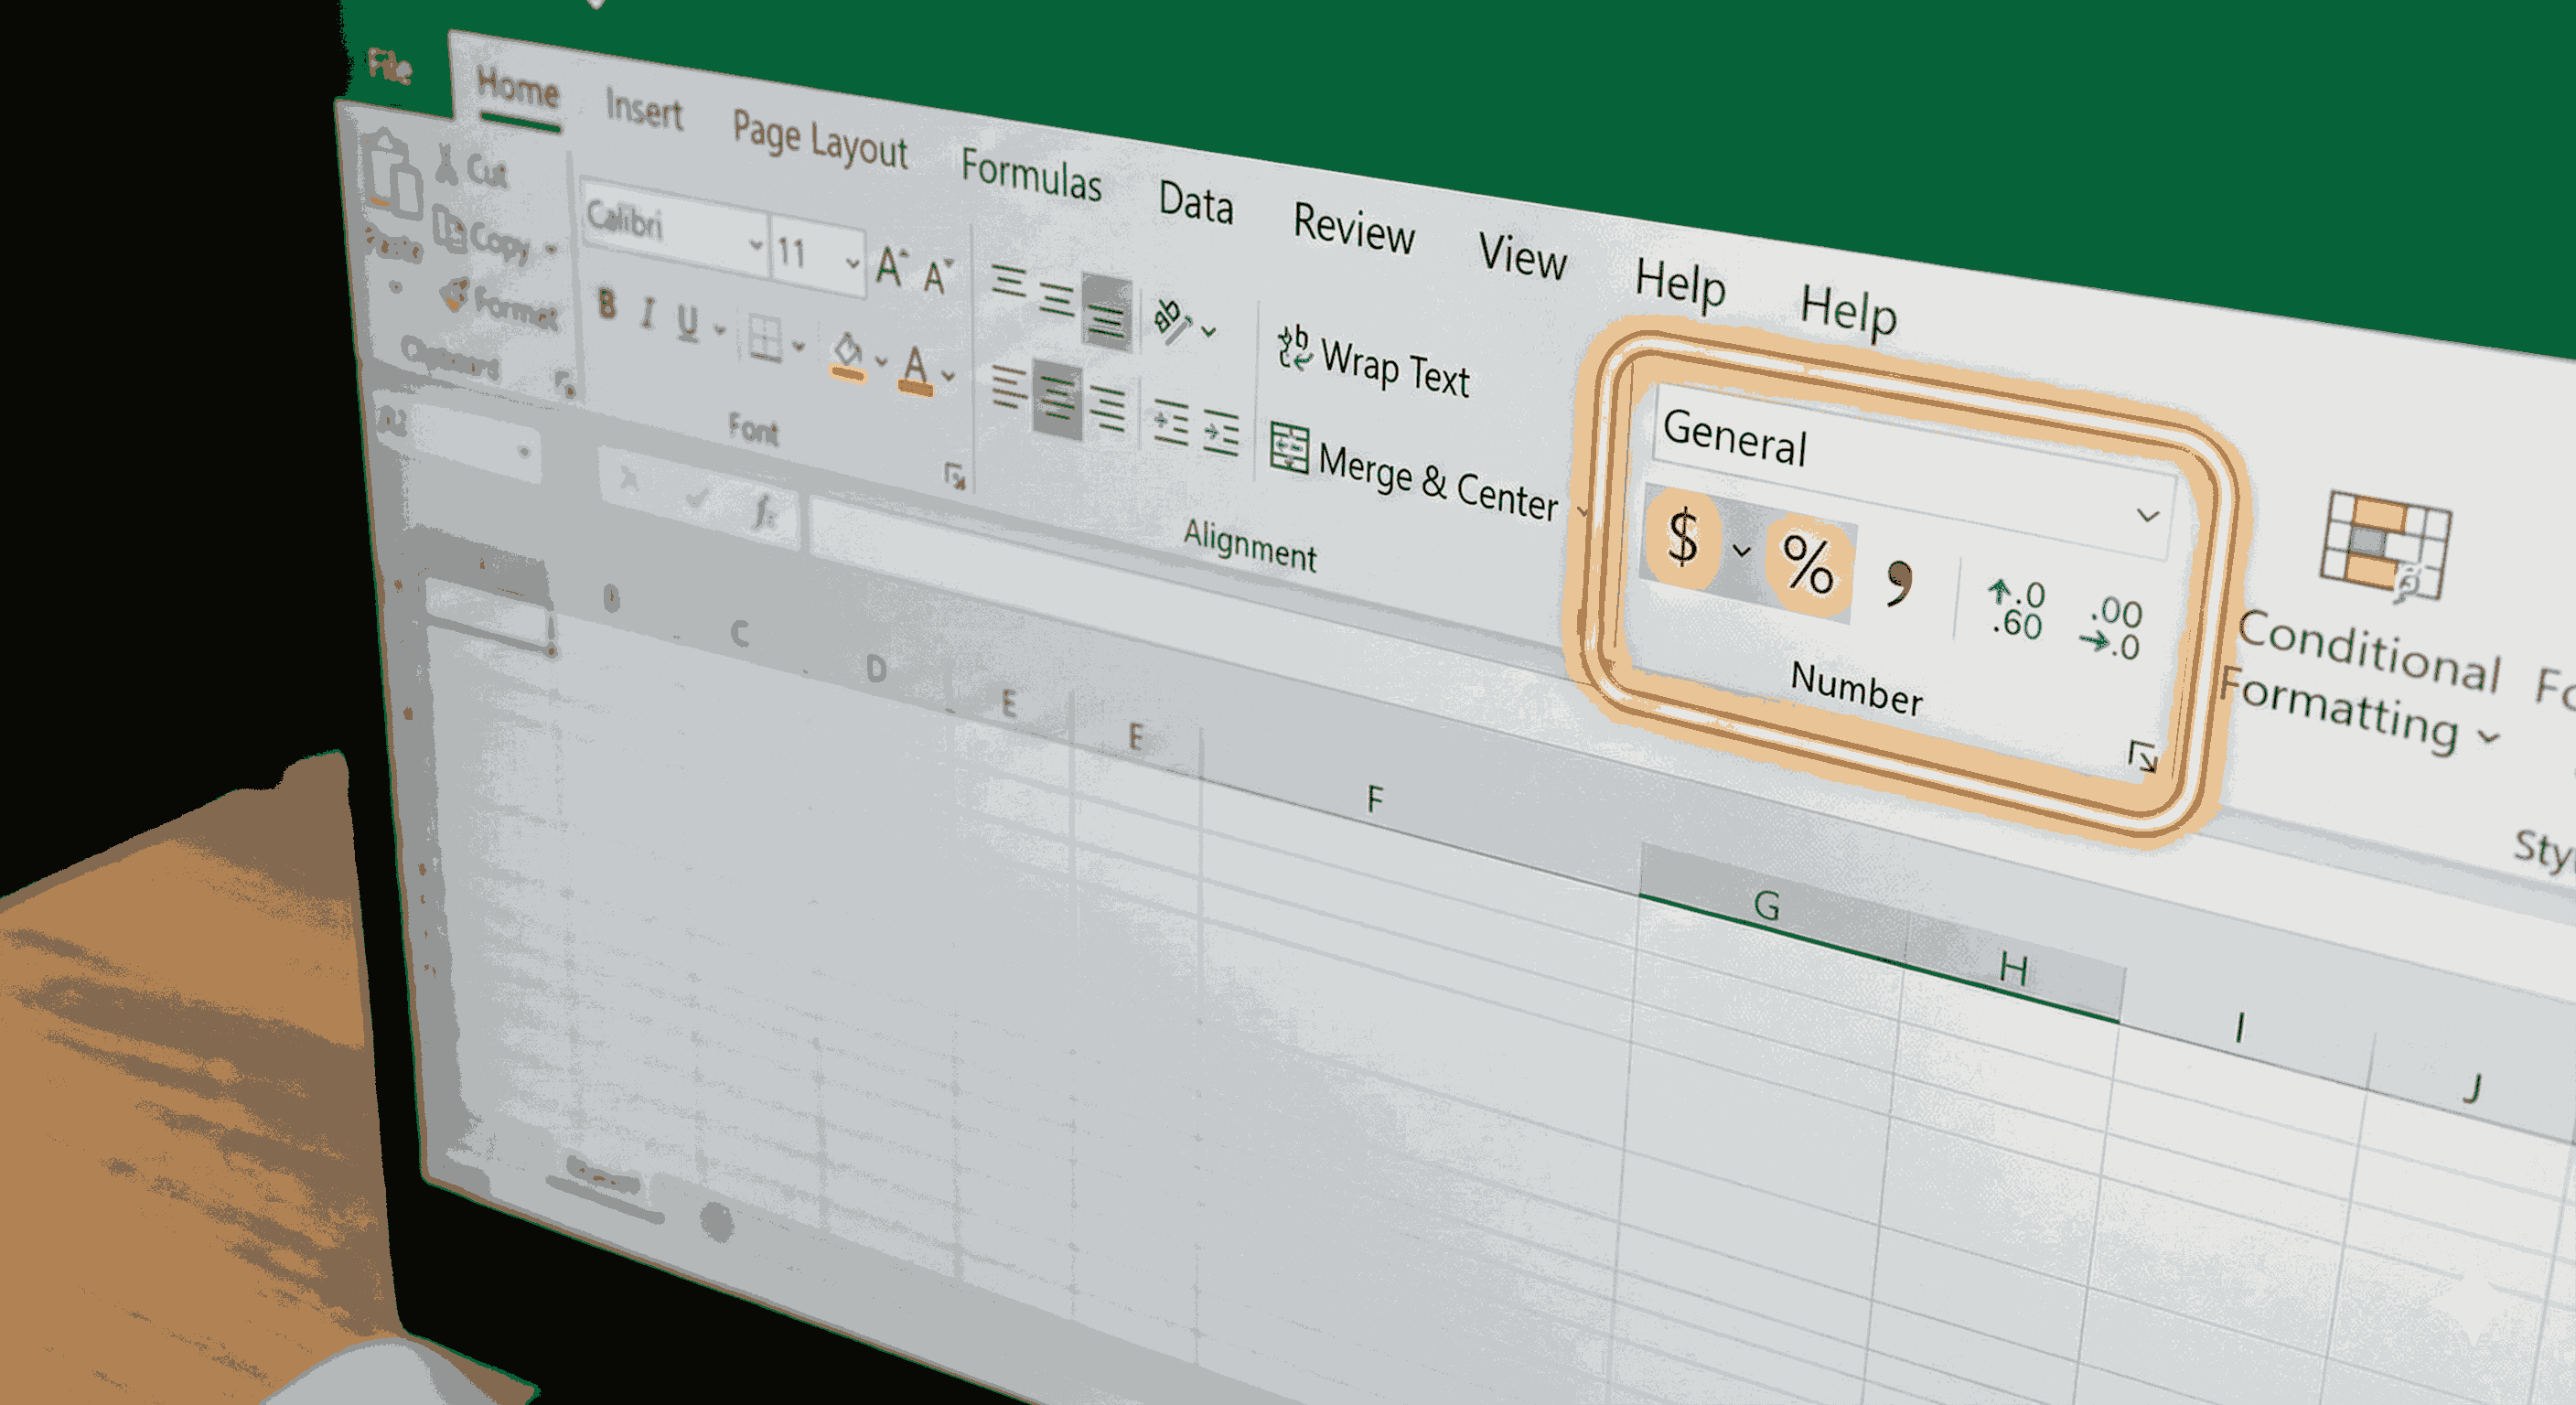
Format as Currency ($)
- Select cells with numbers
- Click $ button
Or press Ctrl + Shift + 4
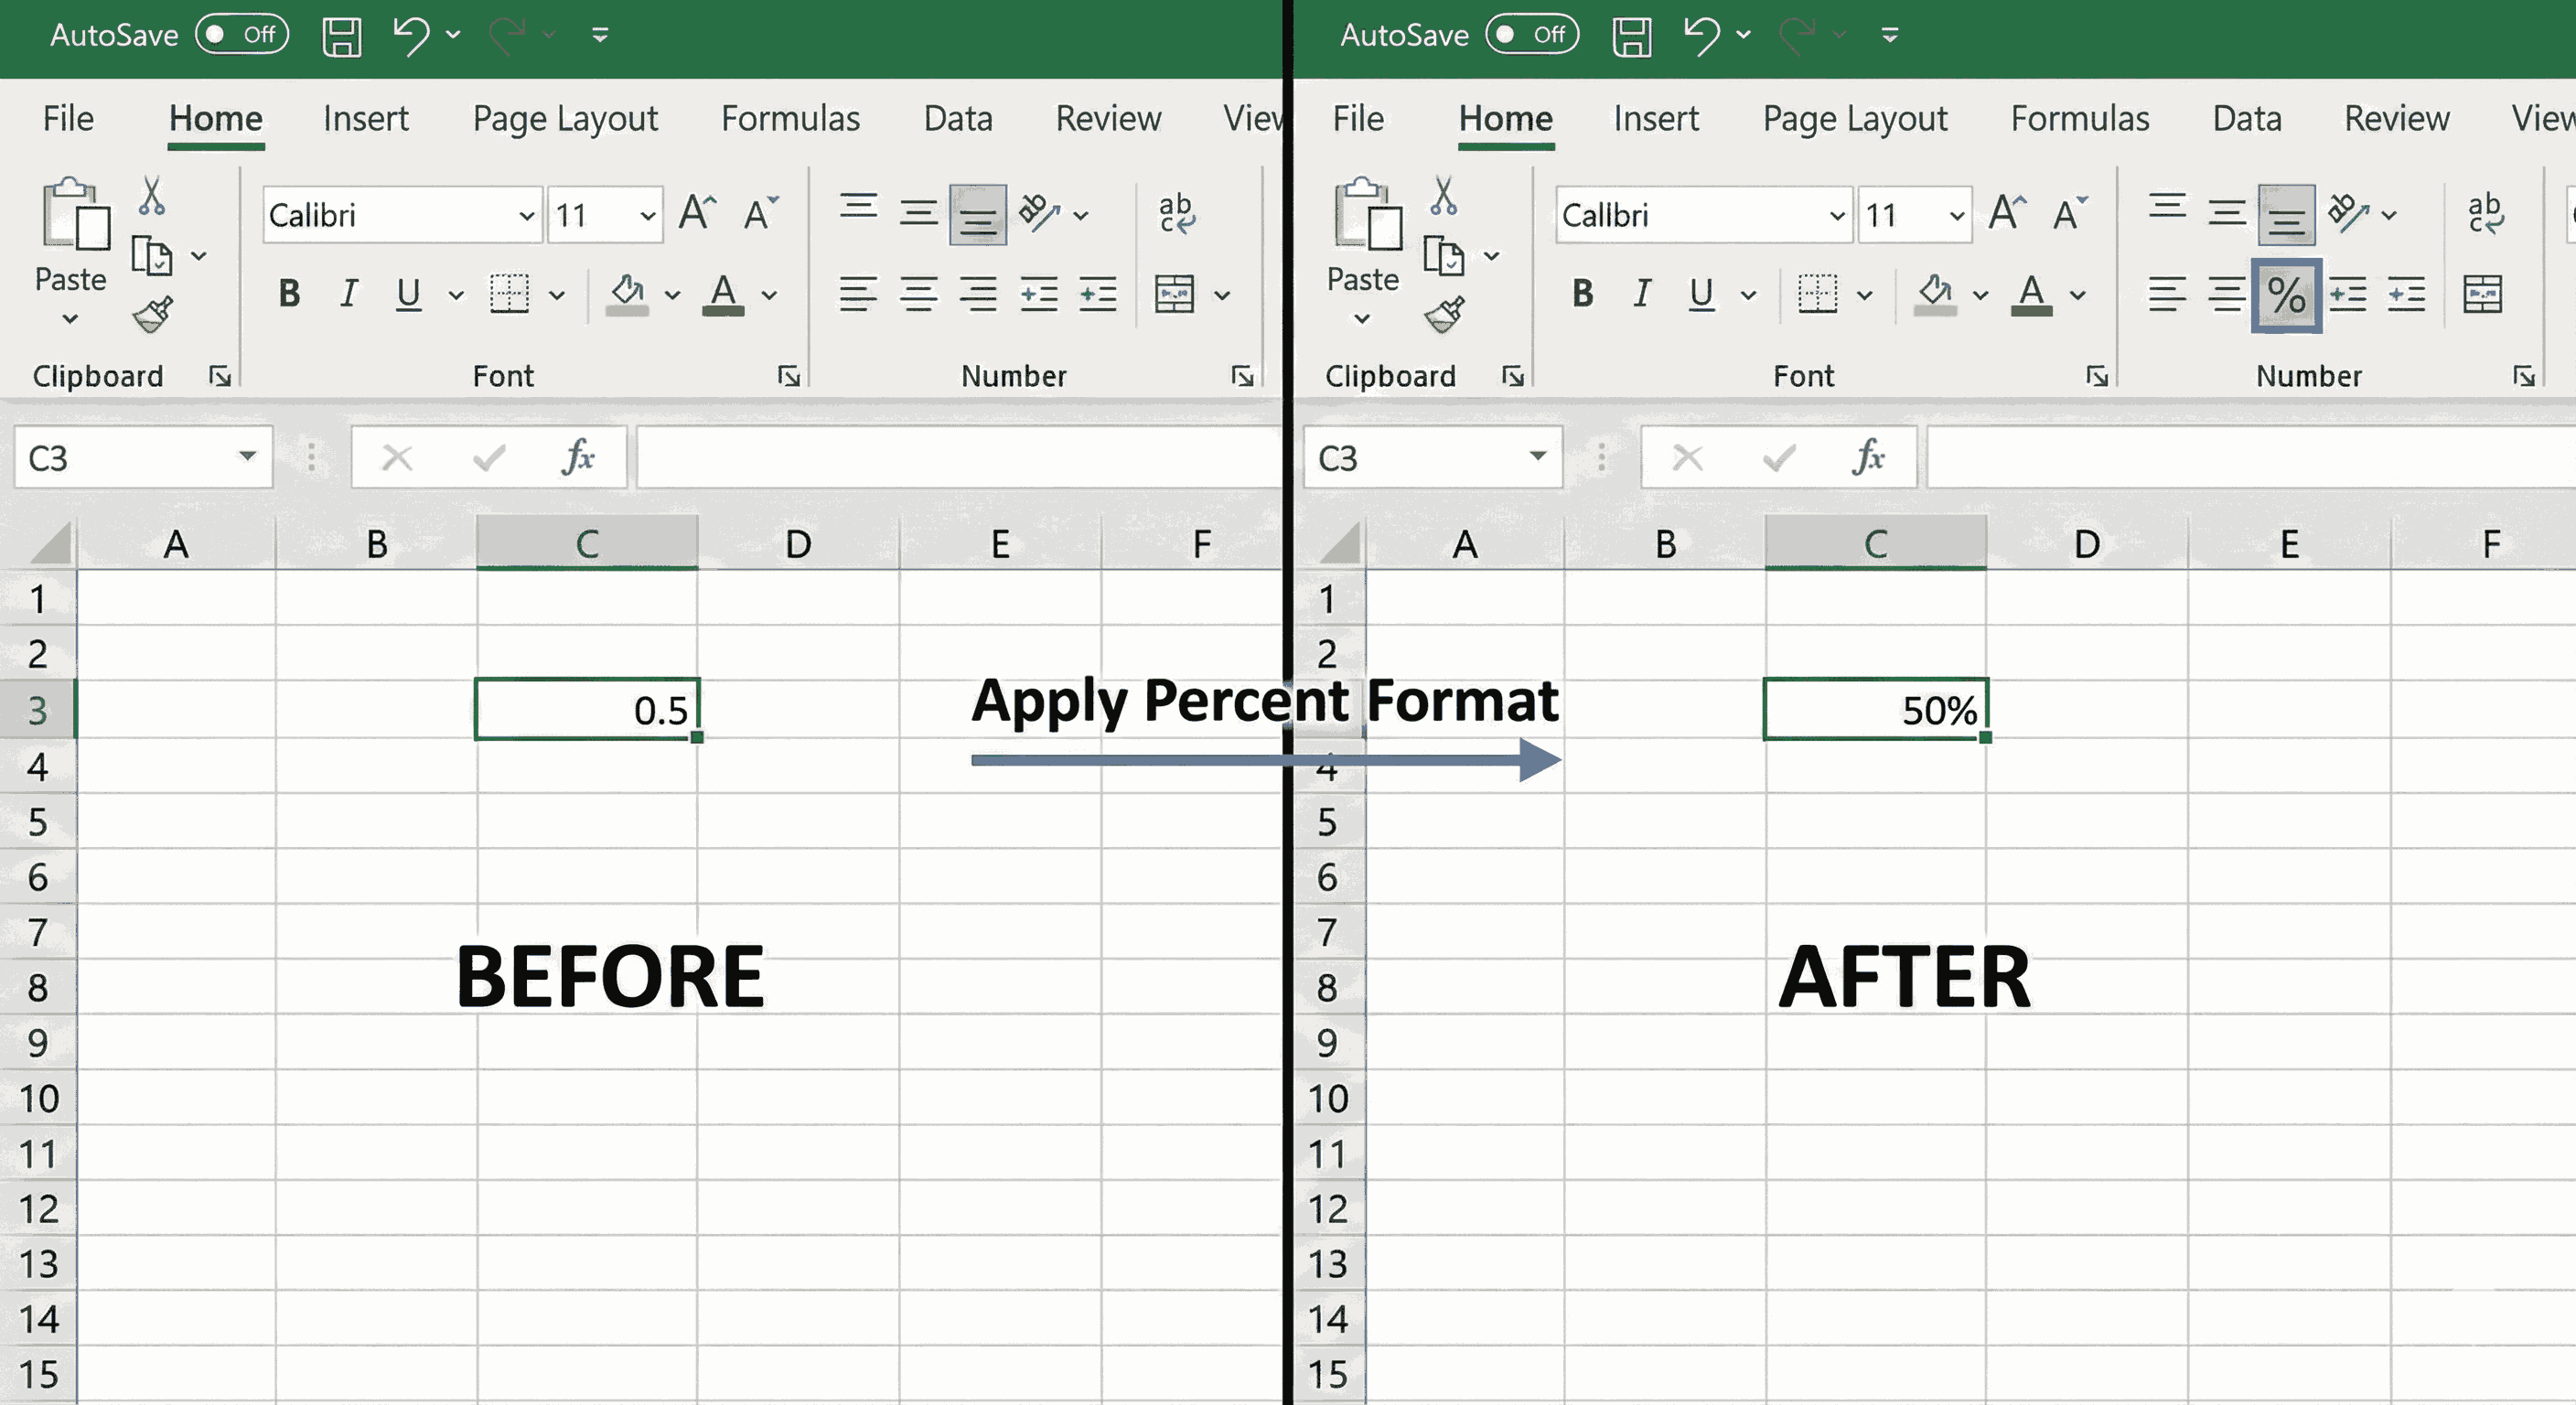
Format as Percentage (%)
- Select cells
- Click % button
Or press Ctrl + Shift + 5
Note: 0.5 becomes 50%
Add Comma (1,000)
- Select cells
- Click Comma button
This adds commas: 1000 → 1,000
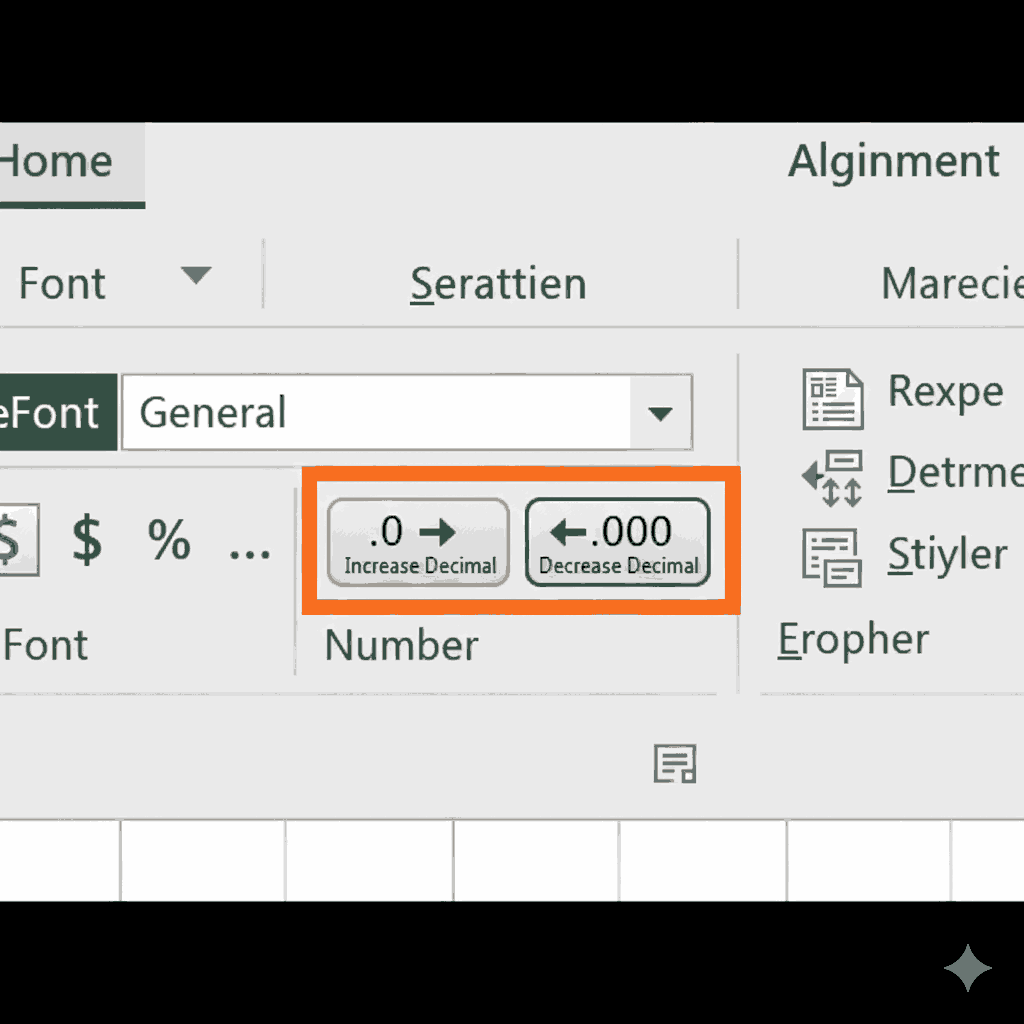
Increase/Decrease Decimals
Use these buttons:
| Button | What It Does |
|---|---|
| .0 → .00 | Add more decimal places |
| .00 → .0 | Remove decimal places |
2 rows
Quick Shortcuts
| Format | Shortcut |
|---|---|
| Currency ($) | Ctrl + Shift + 4 |
| Percentage (%) | Ctrl + Shift + 5 |
| Date | Ctrl + Shift + 3 |
| Number with comma | Ctrl + Shift + 1 |
4 rows
Summary
Borders:
- Select cells → Home → Borders button
- Use "All Borders" for tables
Numbers:
- $ button for currency
- % button for percentage
- Use shortcuts to be faster!